Subscribe to our ▶️ YouTube channel 🔴 for the latest videos, updates, and tips.
Worksheet on Pictographs
In worksheet on pictographs, all grade students can practice the questions on data handling. We can present the given information in many ways. In pictograph the information is presented by using a picture as symbol. A pictograph has a title and a key.
This exercise sheet on pictographs has different questions to draw a pictograph to represent the information that can be practiced by the students to get more ideas to represent the data according to the questions.
A pictograph is a way of representing numerical data by using pictures or symbols i.e., it represents data in the form of pictures, objects or part of objects. These graphs help in the suitable representation of the data
1. Using suitable scale, draw a pictograph for the given data.
Favourite Colour
Red
Yellow
Blue
Orange
Black
Number of Students
25
5
20
15
5
2. The numbers of students studying in each of five classes of a secondary school are given below. Draw a pictograph to represent the numerical data:
3. At a parking place the following number of scooter were parked on different days. Draw a pictograph to represent the information:
Monday (30) Tuesday (25) Wednesday (35)
Thursday (15) Friday (20) Saturday (40)
4. In a survey it was found that the following number of students of a school uses different brands of soaps. Form a pictograph to represent the data:
Lux (100) Lifebuoy (50) Dove (60) Camay (70)
5. The following number of cars of a particular model was produced in the years 2000, 2001, 2002 and 2003. Draw a pictograph to represent the data:
6. From a pond the following numbers of fishes were caught on different days. Draw the pictograph of it:
Monday (200) Tuesday (200) Wednesday (300)
Thursday (400) Friday (300) Saturday (500)
7. The following number of bulbs was sold from a shop on different days. Form the pictograph of it:
Monday (50) Tuesday (30) Wednesday (50)
Thursday (40) Friday (60) Saturday (20)
8. Out of 100 students of a class the following numbers passed in different subjects. Draw the pictograph of the data:
9. Draw a pictograph from the given table in which the number of students studying in different classes of a primary school is given:
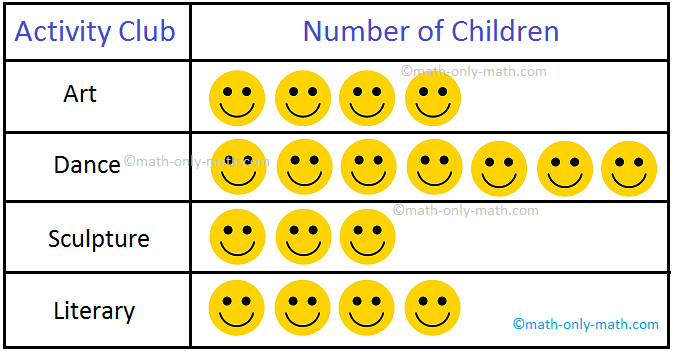
10. Observe the given pictograph and answer the questions.
(i) Which activity club has maximum number of students?
(ii) Which activity club has minimum number of students?
(iii) Which activity clubs have equal number of students?
(iv) How many more students are there in dance club than literary club?
(v) Which activity do you like?
Answer:
(i) Dance
(ii) Sculpture
(iii) Art and Literary
(iv) 6
(v) Dance
11. Read the following pictograph and answer the questions that follow:
Mode of Transport used by the Students of a School
Now answer the following questions:
(i) How many students use the cycle to come to school?
(ii) How many students use the bus to come to school?
(iii) How many fewer students use the car than the scooter?
(iv) What is the total number of students in the school?
Answer:
11. (i) 100 students
(ii) 120 students
(iii) 20 students
(iv) 280 students
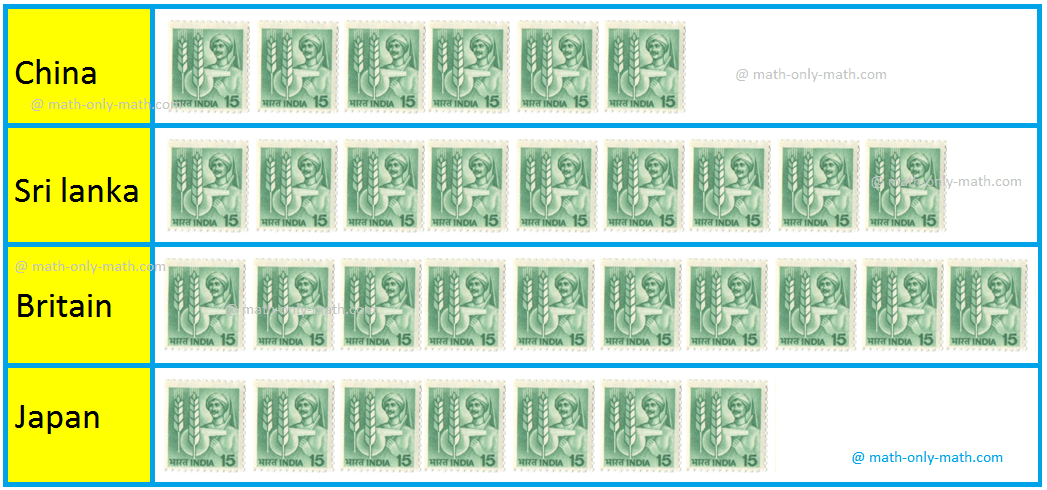
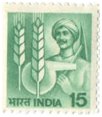
12. Read the following pictograph and answer the questions that follow:
Michael's Collection of Stamps
Now, answer the following questions:
(i) How many Chinese stamps did he collect?
(ii) How many British stamps did he collect?
(iii) If the value of each stamp of Britain is ₹80, find the total value of British stamps.
(iv) How many Japanese stamps were fewer than British stamps?
Answer:
12. (i) 12 stamps.
(ii) 20 stamps.
(iii) ₹1600
(iv) 6 stamps.
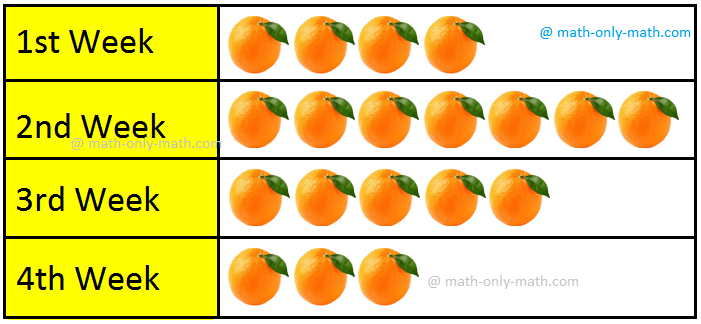
13. The following pictograph shows the number of boxes of oranges sold by a fruit-seller during four weeks of December, 2017:
Oranges Sold During December, 2017
Here, one orange represent 1 box of oranges.
Read the above pictograph and answer the following questions:
(i) How many boxes of oranges did he sell in four weeks?
(ii) In which week was the sale of oranges minimum?
(iii) How many fewer boxes of oranges were sold in the 4th week than the 3rd week?
(iv) What did he earn by selling oranges in the 1st week of December if each box was for ₹ 85?
Answer:
13. (i) 19 boxes
(ii) In 4th week
(iii) 2 boxes
(iv) ₹ 340
14. Donald's shopping list is:
|
Chocolate: Candle: Apple: Match Box: Egg: |
5 10 2 12 |
Show this information in a pictograph. Use one µ for 1 article.
15. David went to a toy-shop. He counted the different kinds of toys sold in a day and noted the number as follows:
|
Cars: Dolls: Aeroplanes: Trucks: |
14 12 10 4 |
Show this information pictorially. Use one to represent 2 toys.
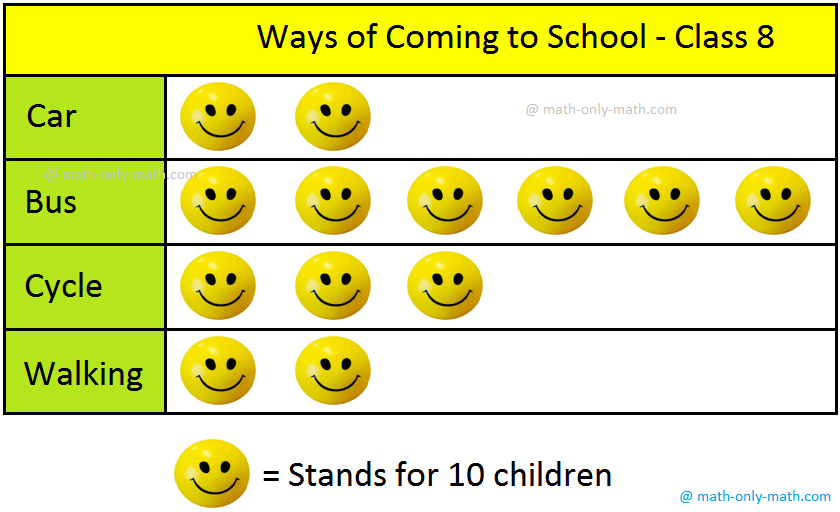
16. This pictograph shows the different ways students from class 8 come to school.
Study the pictograph and answer the questions.
(i) What is the title of the pictograph?
(ii) What does each symbol stand for?
(iii) How many students come to school by bus?
(iv) How many less students walk than cycle to school?
(v) Which are the two equally used ways of coming to school?
Answer:
16. (i) Ways of Coming to school - class 8
(ii) Each symbol stands for 10 children.
(iii) 60 students.
(iv) 10 students
(v) Car and walking
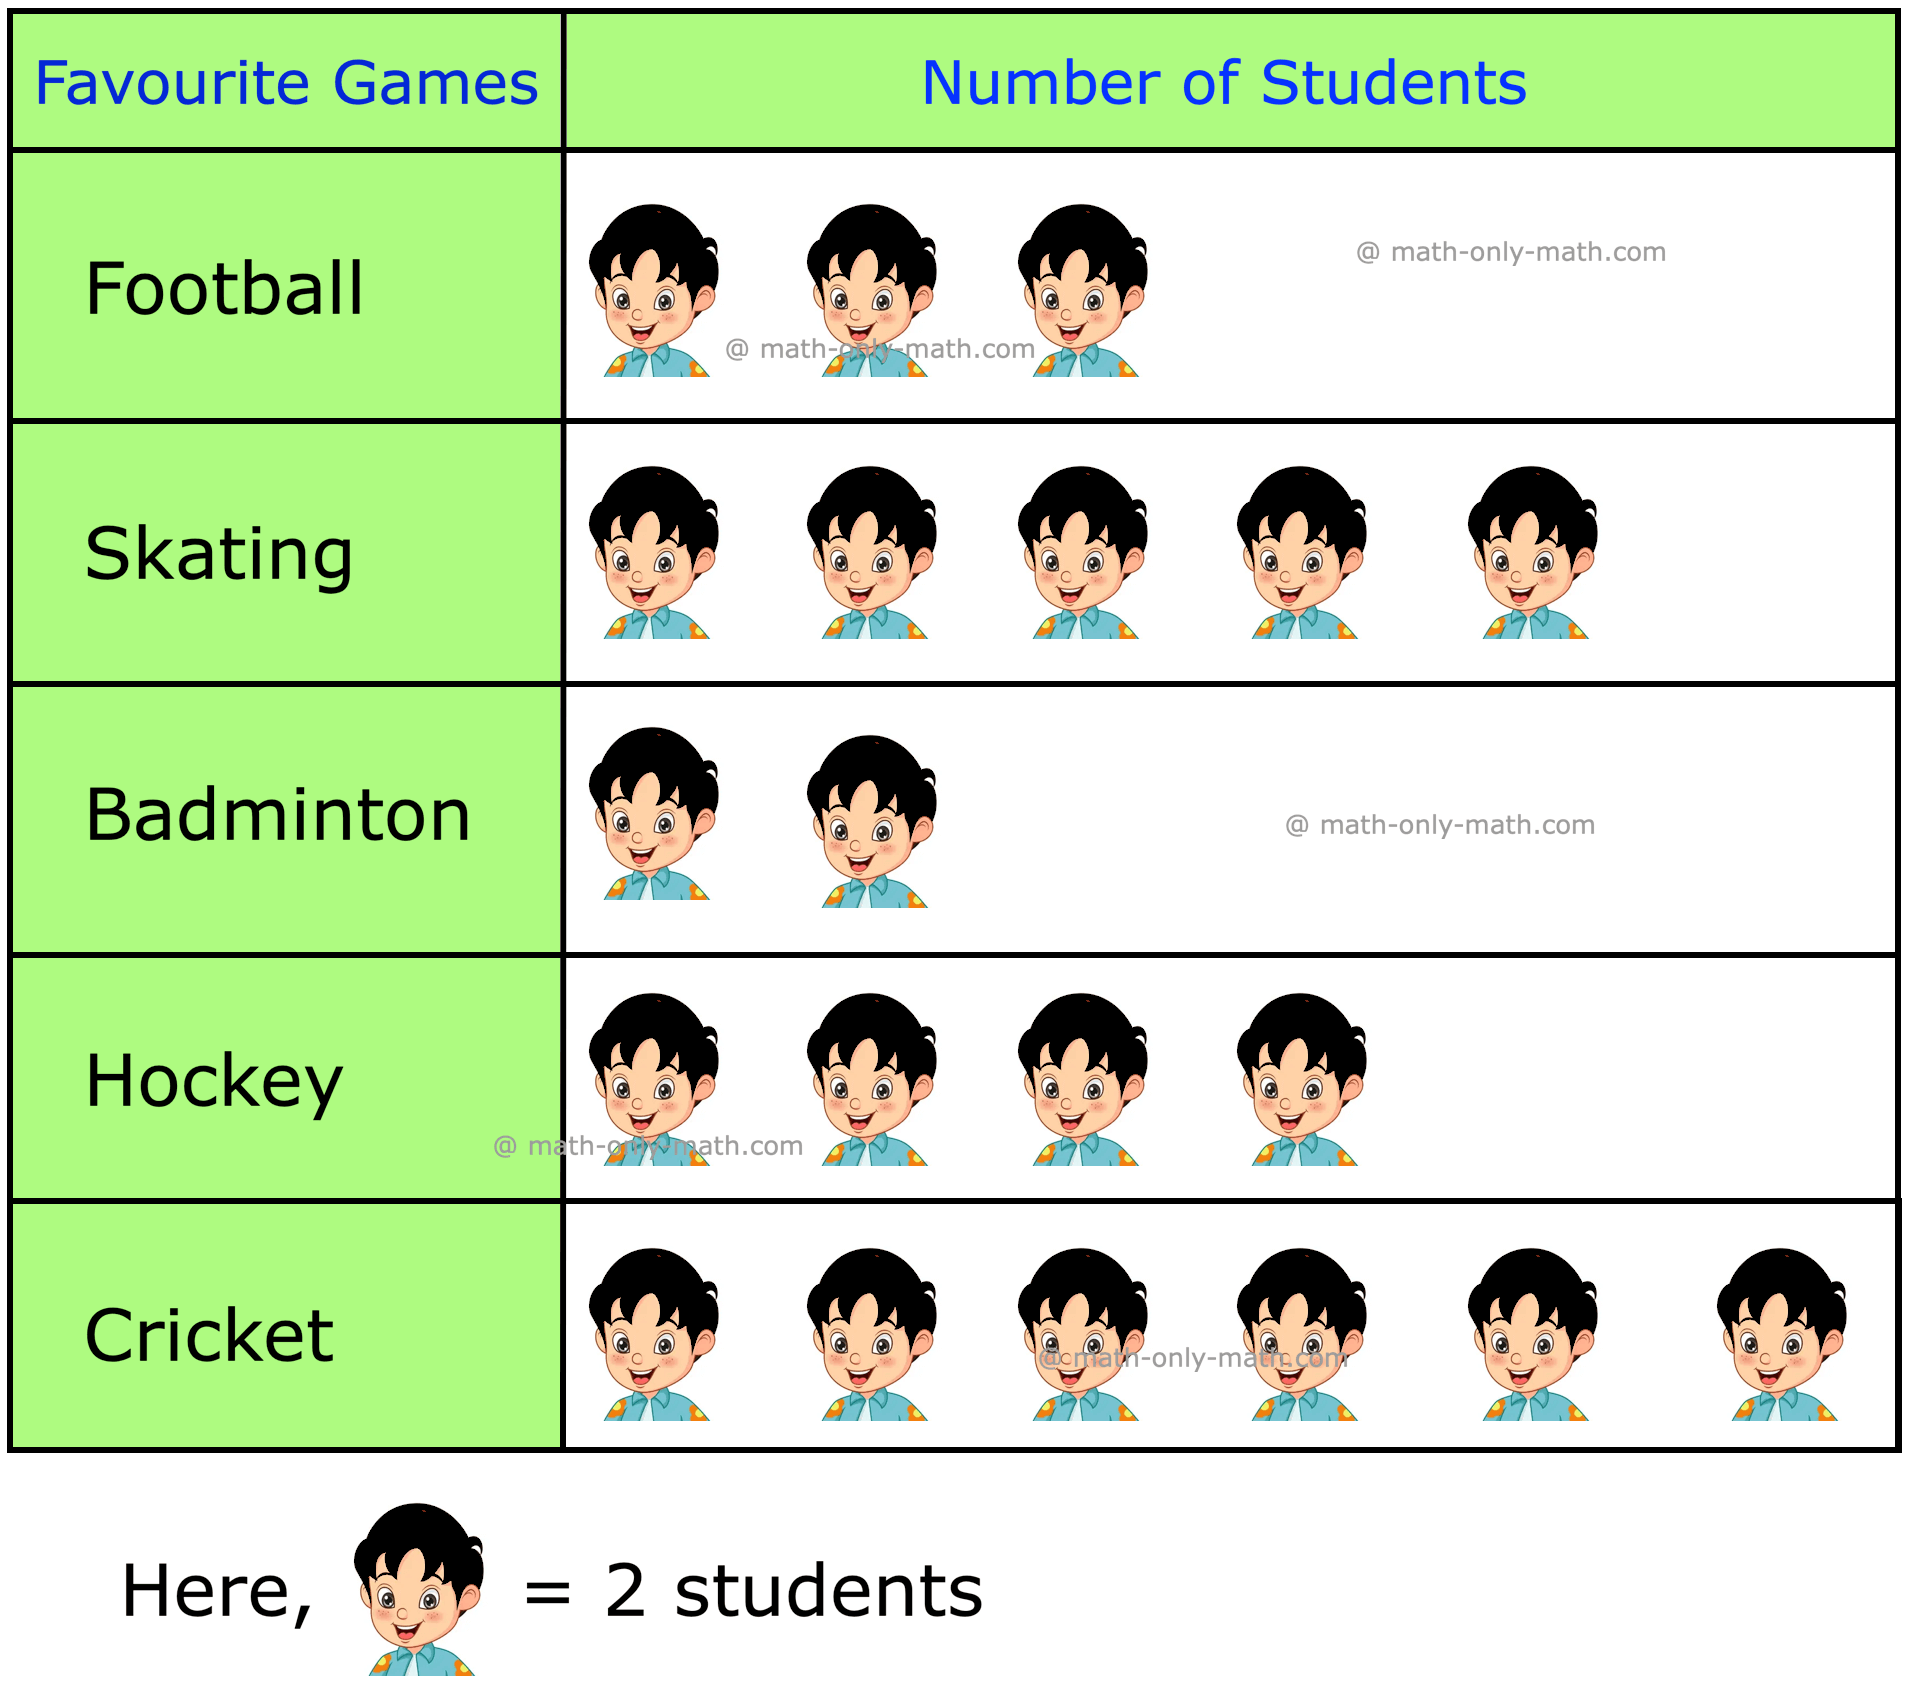
17. Students of Class IV were asked to name their favourite games. Use the pictograph to answer the following questions:
Answer the questions that follow:
(i) Which game is liked by least students?
(ii) How many students like cricket?
(iii) How many students are there in the class?
Answer:
17. (i) Badminton
(ii) 12 students
(iii) 40 students
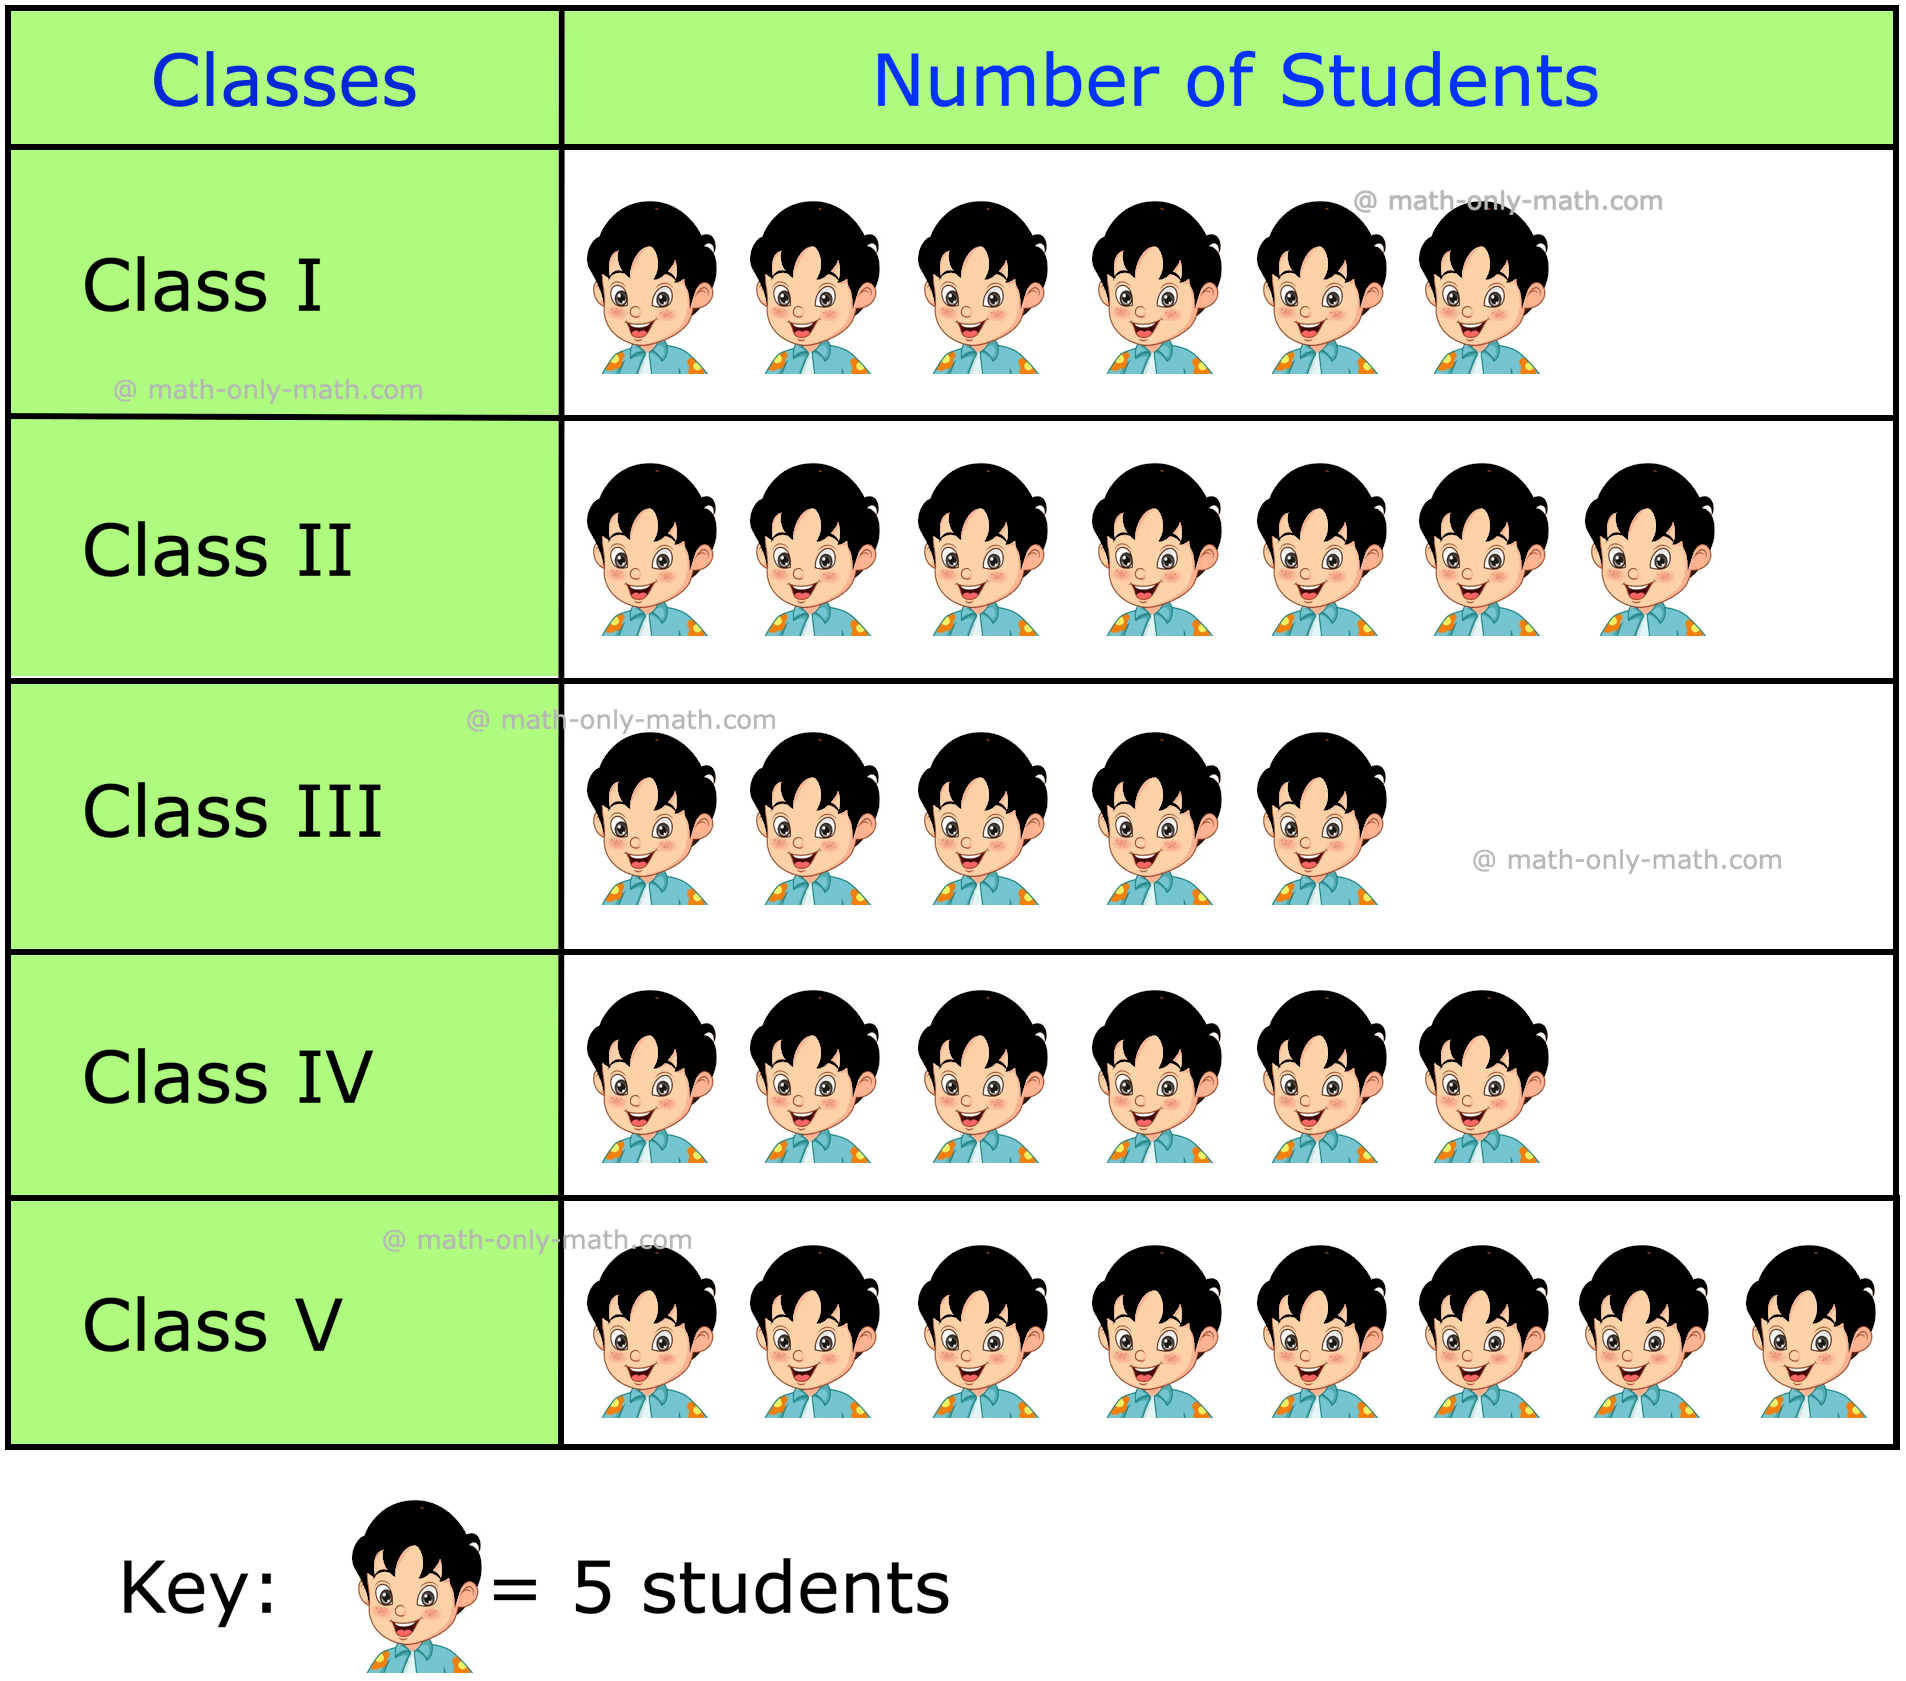
18. Look carefully at the pictograph given below and answer the questions:
Number of students in different classes.
(i) Which class has the highest number of students?
(ii) Which class has the least number of students?
(iii) How many students are there in all?
(iv) Which two classes have the same number of students?
(v) How many more students are there in Class II than Class III?
Answer:
18. (i) Class V
(ii) Class III
(iii) 160 students
(iv) Class I and Class IV
(v) 10 students
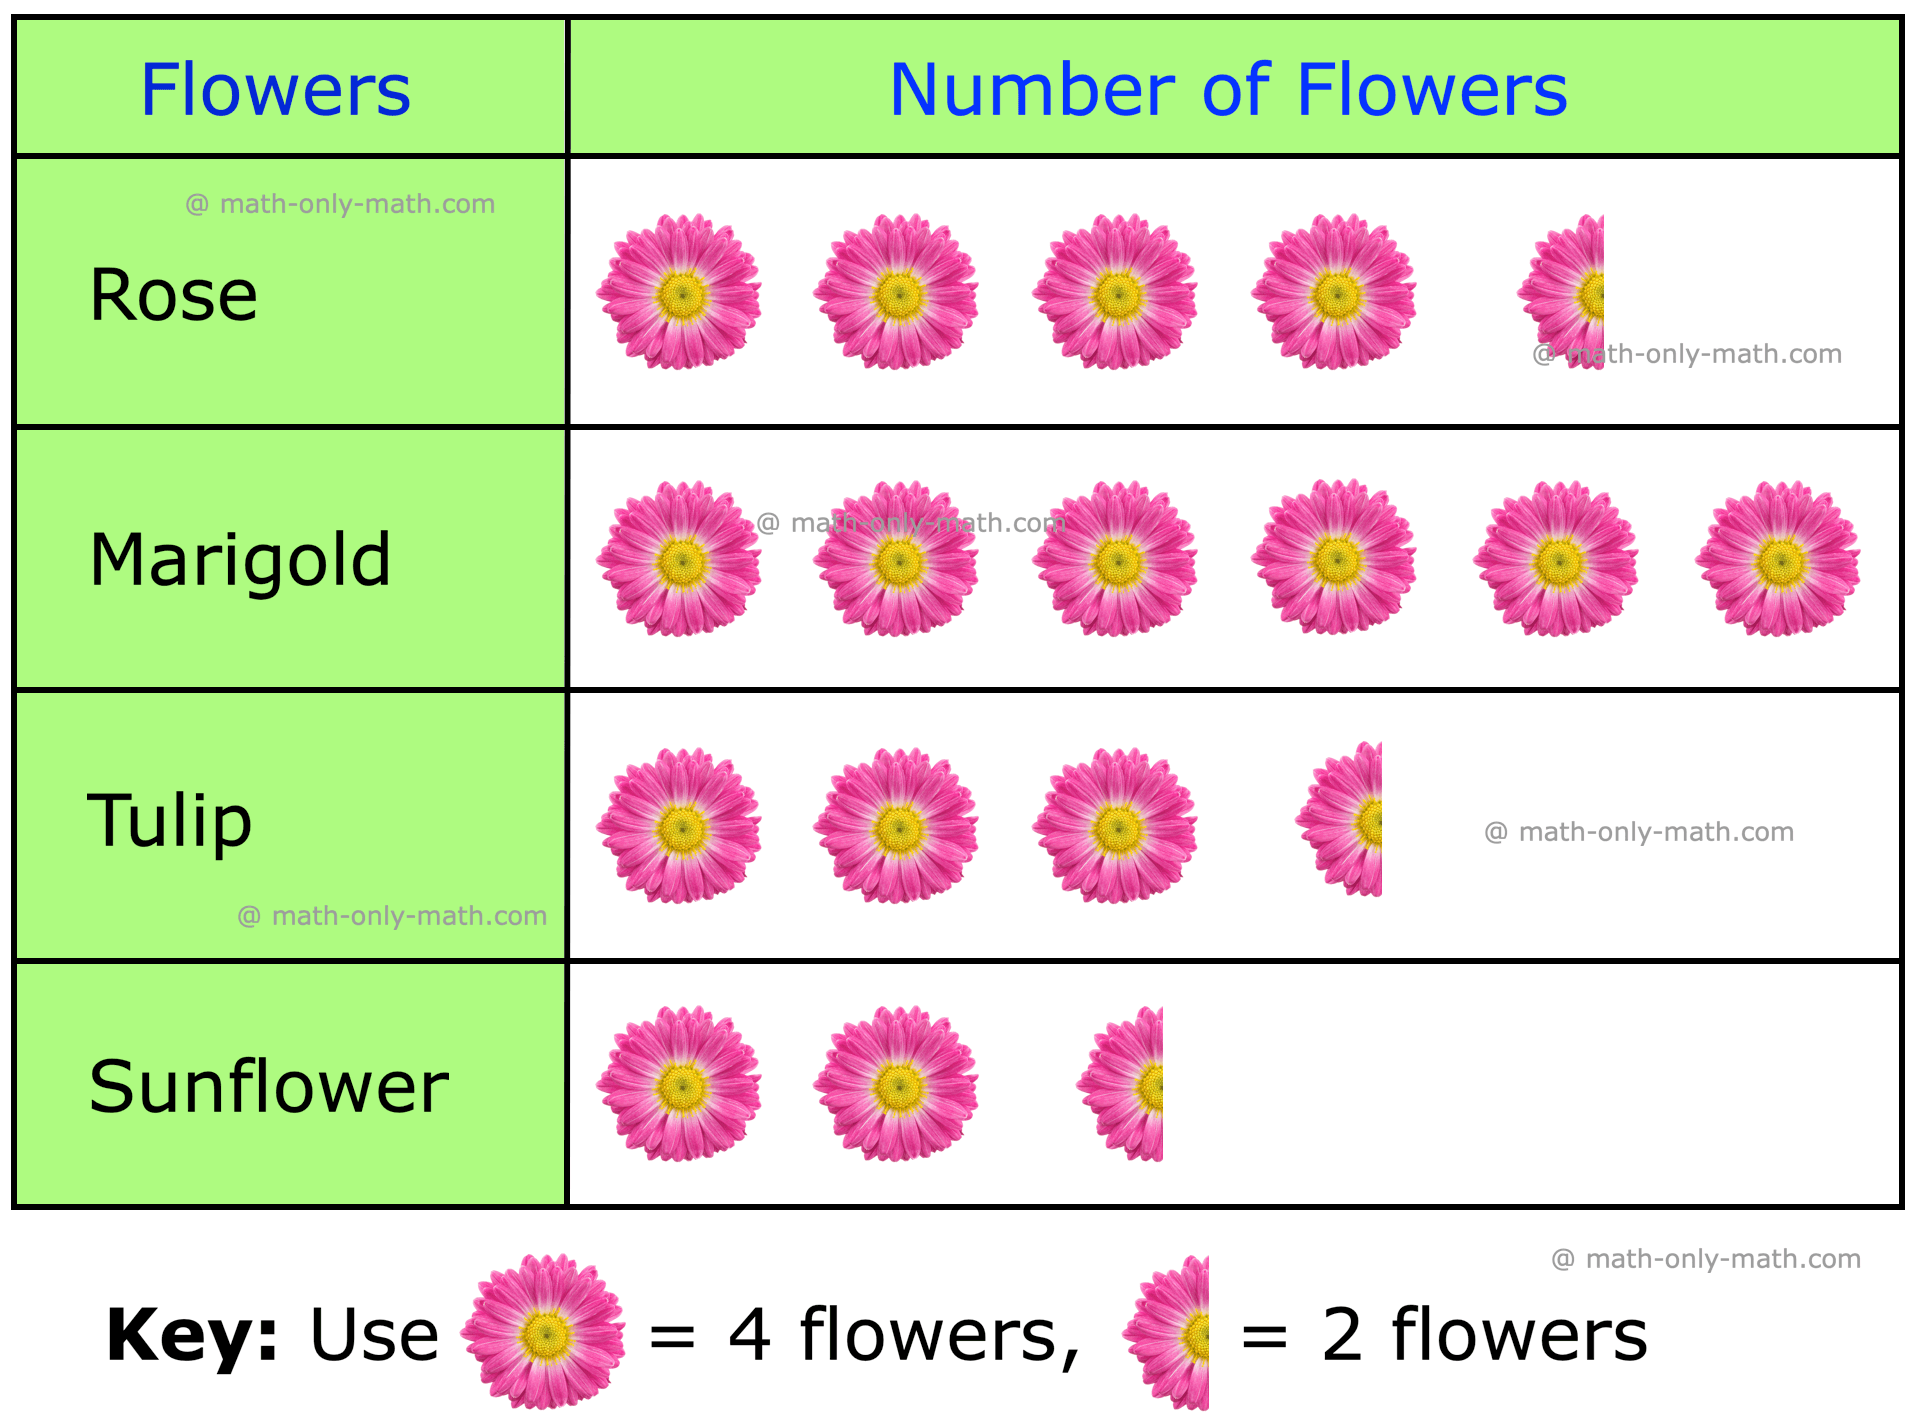
19. Draw a pictograph showing the different types of flowers in a garden.
Flowers
Rose
Marigold
Tulip
Sunflower
Number of Flowers
18
24
14
10
Answer:
19.
20. Draw a pictograph showing different animals and their number.
Key: Picture of each animal represents 2 animals.
Animals
Zebra
Tiger
Deer
Elephant
Giraffe
Number
14
7
13
9
5
If students have any queries regarding the questions given in the worksheet on pictographs, please contact us so that we can help you.
Data Handling - Worksheets
• Worksheet on Interpreting a Pictograph
4th Grade Math Worksheets
From Worksheet on Pictographs to HOME PAGE
Didn't find what you were looking for? Or want to know more information about Math Only Math. Use this Google Search to find what you need.







New! Comments
Have your say about what you just read! Leave me a comment in the box below. Ask a Question or Answer a Question.