Subscribe to our ▶️ YouTube channel 🔴 for the latest videos, updates, and tips.
Worksheet on Data Handling
In math practice worksheet on data handling we will solve numerous types of questions on handling data, frequency distribution and on grouping data.
Worksheet on Data Handling
1. Complete the given blank.
(i) __________ is the quick way of recording the data.
(ii) A bar graph can be drawn using __________ or __________ bars.
(iii) Pictograph is the representation of data through __________.
(iv) __________ can be both numbers and words.
2. Carol wants to make a bar graph to show counts of 5, 20, 15 and 10. Which is a better scale for use? Circle the right answer.
(i) 1, 2, 3, 4, 5 ............ (ii) 5, 10, 15, 20 ............
3. Show the data in the table using a bar graph. Use a suitable scale.
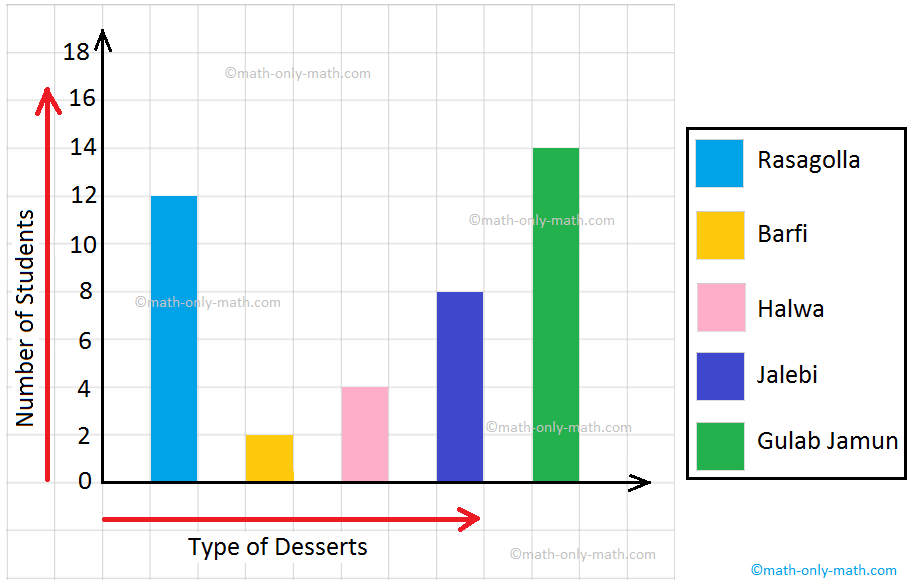
4. Ms. Thomas asked each of her students about their favourite dessert. Based on their responses, she drew the bar graph.
Answers the following questions.
(i) Which is the favourite dessert and how many students made that choice?
(ii) How may students chose rasogolla as their favourite dessert?
(iii) What was the least favourite dessert?
(iv) How many more students selected jalebi than barfi?
(v) How many students are in the class?
Questions on frequency distribution and data analysis:
5. The number of members in 20 families are given below:
4, 6, 5, 5, 4, 6, 3, 3, 5, 5, 3, 5, 4, 4, 6, 7, 3, 5, 5, 7
Prepare a frequency distribution of data.
6. A dice was thrown 30 times and the following outcomes were noted:
2, 1, 2, 4, 6, 1, 2, 3, 6, 5, 4, 4, 3, 1, 1, 3, 1, 1, 5, 6, 6, 2, 2, 3, 4, 2, 5, 5, 6, 4
Prepare a frequency table.
7. The following data gives the number of children in 40 families:
1, 2, 6, 5, 1, 5, 1, 3, 2, 6, 2, 3, 4, 2, 0, 4, 4, 3, 2, 2, 0, 0, 1, 2, 2, 4, 3, 2, 1, 0, 5, 1, 2, 4, 3, 4, 1, 6, 2, 2
Represent it in the form of a frequency distribution.
8. The marks obtained by 40 students of a class in an examination are given below:
8, 47, 22, 31, 17, 13, 38, 26, 3, 34, 29, 11, 22, 7, 15, 24, 38, 31, 21, 35, 42, 24, 45, 23, 21, 27, 29, 49, 25, 48, 21, 15, 18, 27, 19, 45, 14, 34, 37, 34
Prepare a frequency distribution table with equal class intervals, starting from 0-10 (where 10 is not included).
9. The electricity bills (in dollars) of 25 houses of a certain locality for a month are given below:
324, 700, 617, 400, 356, 365, 435, 506, 548, 736, 780, 378, 570, 685, 312, 630, 584, 674, 754, 776, 596, 745, 565, 763, 472
Arrange the above data in increasing order and form a frequency table using equal class intervals, starting from 300-400, where 400 is not included.
10. The weekly wages (in dollars) of 28 workers of a factory are given below:
668, 610, 642, 658, 668, 620, 719, 720, 700, 690, 710, 642, 672, 654, 692, 706, 718, 702, 704, 678, 615, 640, 680, 716, 705, 615, 636, 656
Construct a frequency table with equal class intervals, taking the first of the class intervals as 610-630, where 630 is not included.
Worksheet on Data Handling
11. The weekly pocket expenses (in dollars) of 30 students of a class are given below:
62, 80, 110, 75, 84, 73, 60, 62, 100, 87, 78, 94, 117, 86, 65, 68, 90, 80, 118, 72, 95, 72, 103, 96, 64, 94, 87, 85, 105, 115
Construct a frequency table with class intervals 60-70 (where 70 is not included) 70-80, 80-90 etc.
12. The daily earnings (in dollars) of 24 stores in a market was recorded as under:
715, 650, 685, 550, 573, 530, 610, 525, 742, 680, 736, 524, 500, 585, 723, 545, 532, 560, 580, 545, 625, 630, 645, 700
Prepare a frequency table taking equal class sizes. One such class is 500-550, where 550 is not Included.
13. The heights (in cm) of 22 students were recorded as under:
125, 132, 138, 144, 142, 136, 134, 125, 135, 130, 126, 132, 135, 142, 143, 128, 126, 136, 135, 130, 130, 133
Prepare a frequency distribution table, taking equal class intervals and starting from 125 - 130, where 130 is not included.
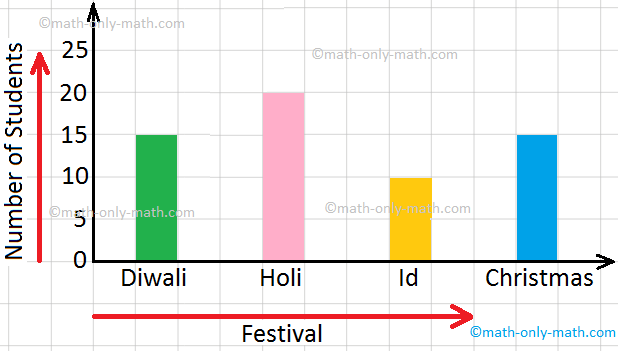
14. Look at the bar graph given below and choose the right answer.
(i) Which festival is likes by maximum students?
(a) Holi (b) Diwali (c) Id (d) Christmas
(ii) Which festival is liked by minimum students?
(a) Holi (b) Diwali (c) Id (d) Christmas
(iii) Which festivals are liked by equal number of students?
(a) Diwali and Id (b) Holi and Christmas (c) Holi and Id (d) Diwali and Christmas
(iv) How many students like Holi?
(a) 3 (b) 4 (c) 6 (d) 20
(v) How many students like Id?
(a) 2 (b) 4 (c) 6 (d) 10
(vi) Which festival is liked by 10 students?
(a) 2 (b) 4 (c) 6 (d) 10
15. A dice was thrown 30 times and the following outcomes were noted:
2 5 5 6 3 3 5 4 4 4
3 2 6 2 3 1 3 2 4 6
2 4 1 6 6 6 3 4 5 1
Represent the above data in the form of a frequency distribution table.
16. In a village, there are 34 families. A survey is conducted by a company of dairy products to record the number of buffaloes the families have in the village. The results are given below:
12 6 1 8 5 8 12 7 12 4
14 10 12 13 11 12 7 14 8 12
9 14 5 2 6 9 7 5 12 2
3 1 12 5
(i) Prepare frequency distribution table for the above data.
(ii) How many families have 12 buffaloes?
(iii) How many families have the maximum number of buffaloes?
(iv) How many families have the minimum number of buffaloes?
17. The players of class VI cricket team of a school made following runs in one day math?
30 0 2 29 20 15 25 12
11 19
make a frequency distribution table.
18. Given below is the information about 105 TVs sold from a shop during first five days of a week.
|
Day |
Number of TVs Sold |
|
Sunday Monday Tuesday Wednesday Thursday |
20 10 25 35 15 |
Drawn pictograph for this information.
19. The following table shows the number of students of Class VIII who passed in various subjects.
|
Subject |
Number of Students |
|
Mathematics Science Social Studies English Spanish |
14 18 16 23 21 |
The Represent the above data by a pictograph.
20. Following table shorts the number of electric bulbs purchased for a lodging house during the first five month of a year.
Month
January
February
March
April
May
Number of Bulbs
20
30
40
15
25
Represent it by a pictograph.
21. The table given below shows the number of students playing four different games.
Games
Football
Hockey
Cricket
Badminton
Number of Students
200
150
100
50
Present this information by a pictograph. You can use stickers to make the pictograph
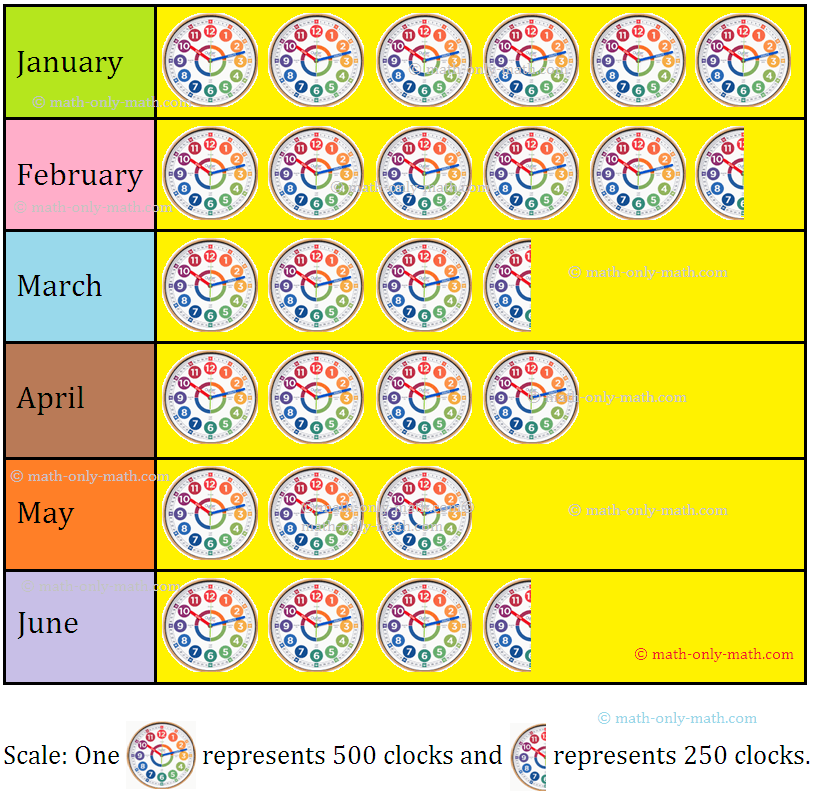
22. Following is the pictograph of the number of clocks manufactured by a company in the first six months of a year:
Observe this pictograph and answer the following questions:
(i) In which month was the maximum number of wrist watches manu-factured?
(ii) How many clocks were manufactured in March?
(iii) Is the number of clocks manufactured in June is less than that manufactured in April?
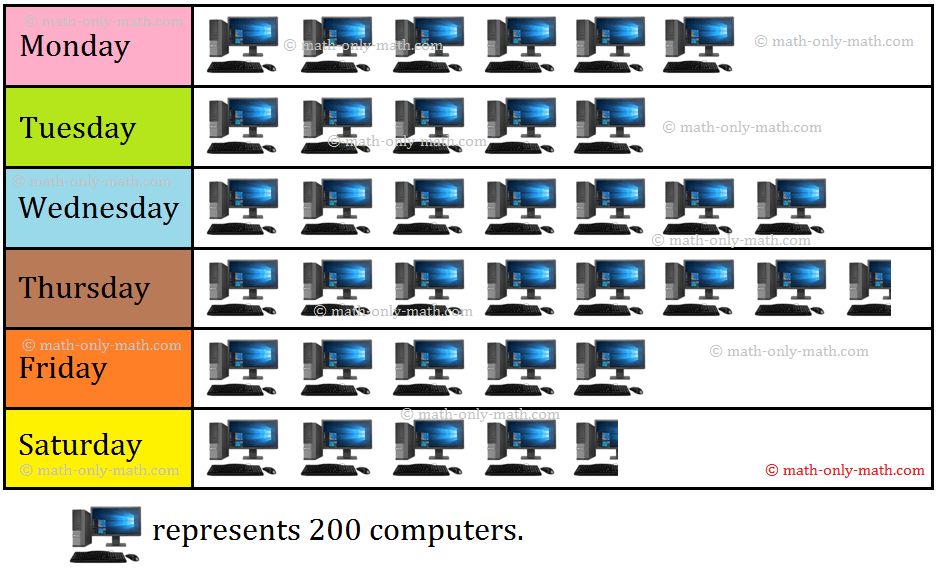
23. The following pictograph represents the daily production of computers in a factory for different days of a week.
Now answer the following questions:
(i) Find the total number of computers produced in the factory during the week.
(ii) On which day were the minimum number of computers manufactured.
(iii) On which day were the maximum number of computer manufactured.
(iv) How many less computers were manufactured on Saturday than on Friday?
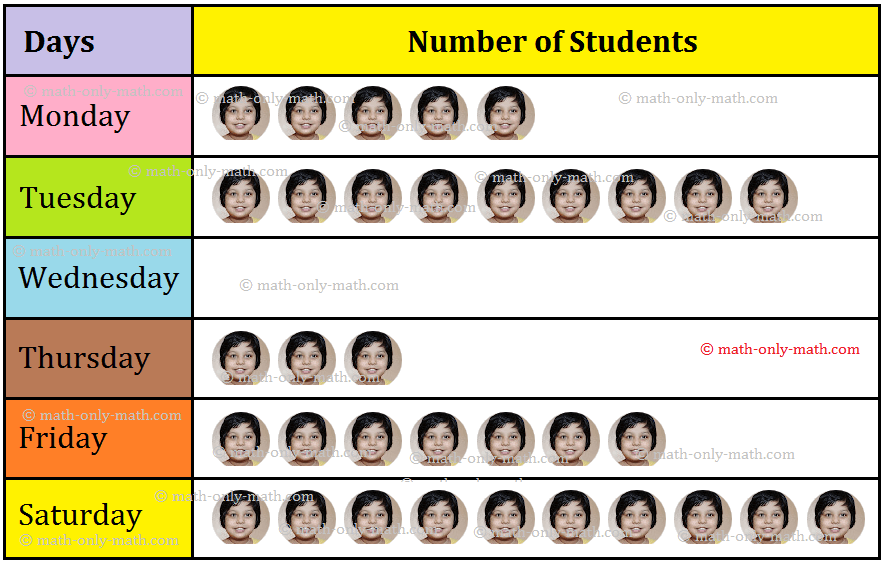
24. In a class of 34 children, absentees in a particular week were shown by a pictograph as shown here?
Read the pictograph and answer the following questions.
(i) How many children were absent on Saturday?
(ii) On which day were there only three absentees?
(iii) On which day were there maximum absentees?
(iv) How many children were absent on Wednesday?
25. Multiple Choice Questions (MCQ) on Data Handling:
Tick (✔) the correct option.
(i) The difference of maximum and minimum value in data is called.
(a) Range (b) Data (c) Frequency (d) None
(ii) A collection of numbers gathered to get some information is called.
(a) Range (b) Data (c) Frequency (d) None
(iii) Frequency of 4 in the data 4, 3, 2, 3, 4, 5, 6, 2, 1 is
(a) 1 (b) 2 (c) 3 (d) 0
(iv) Pictorial representation of data is called
(a) Bar graph (b) Histogram (c) Pictograph (d) None
(v) The range of data 4, 5, 7, 9, 10, 3, 2, 1 is
(a) 8 (b) 9 (c) 7 (d) 6
(vi) The width of all the rectangles in a bar graph is always
(a) Equal (b) Unequal (c) Double (d) None
(vii) Sum of all the frequencies is always equal to the total number of
(a) Data (b) Range (c) Frequency (d) Observations
(viii) Number of times a particular value in data occurs is called its
(a) Range (b) Data (c) Frequency (d) None
26. Fill in the blanks:
(i) In a bar graph, the bars are of equal width but their heights or length are __________.
(ii) Bar graphs are drawn usually __________ but they can also be drawn __________.
(iii) Representing data in the form of picture is called __________.
(iv) Data in the form of number is called __________.
(v) Data can be arranged in a tabular form using __________.
Answers for worksheet on data handling are given below to check the exact answers of the given questions in data handling.
Answers:
1. (i) Tally marks
(ii) horizontal, vertical
(iii) pictures
(iv) data
2. (ii)
4. (i) Gulab jamun, 14
(ii) 12
(iii) Barfi
(iv)
(v)
5.
| Number of members | 3 | 4 | 5 | 6 | 7 |
| Frequency |
6.
| Outcome | 1 | 2 | 3 | 4 | 5 | 6 |
| Frequency |
7.
| Wages (in Dollars) | 1 | 3 | 4 | 5 | 6 | ||
| Frequency |
8.
| Marks | 0 - 10 | 10 - 20 | 20 - 30 | 30 - 40 | 40 - 50 |
| Frequency |
9.
| Amount of the bill (in Dollars) |
300 - 400 | 400 - 500 | 500 - 600 | 600 - 700 | 700 - 800 |
| Frequency |
10.
| Wages (in Dollars) |
610-630 | 630-650 | 650-670 | 670-690 | 690-710 | 710-730 |
| Frequency |
11.
| Expenses (in Dollars) |
60 - 70 | 70 - 80 | 80 - 90 | 90 - 100 | 100 - 110 | 110 - 120 |
| Frequency |
12.
| Daily earnings (in Dollars) |
500 - 550 | 550 - 600 | 600 - 650 | 650 - 700 | 700 - 750 |
| Frequency |
13.
| Height(in cm) | 125 - 130 | 130 - 135 | 135 - 140 | 140 - 145 |
| Frequency |
14. (i) → (a)
(ii) → (c)
(iii) → (d)
(iv) → (d)
(v) → (d)
(vi) → (c)
25. (i) → (a) Range
(ii) → (b) Data
(iii) → (b) 2
(iv) → (c) Pictograph (d) None
(v) → (b) 9
(vi) → (a) Equal
(vii) → (d) Observations
(viii) → (c) Frequency
26. (i) different
(ii) vertically, horizontally.
(iii) pictograph
(iv) numerical data
(v) tally marks
● Data Handling
● Data Handling - Worksheet
From Worksheet on Data Handling to HOME PAGE
Didn't find what you were looking for? Or want to know more information about Math Only Math. Use this Google Search to find what you need.


New! Comments
Have your say about what you just read! Leave me a comment in the box below. Ask a Question or Answer a Question.