Examples of Pictographs
Some sample examples on pictographs or pictorial representation are shown, how the objects are used to give information regarding mathematical data.
Read the pictograph and gather the information from the different objects whose pictures or symbols are used in the table.
Some solved examples on picture-graph:
Let us now learn how to understand a pictograph with the following example.
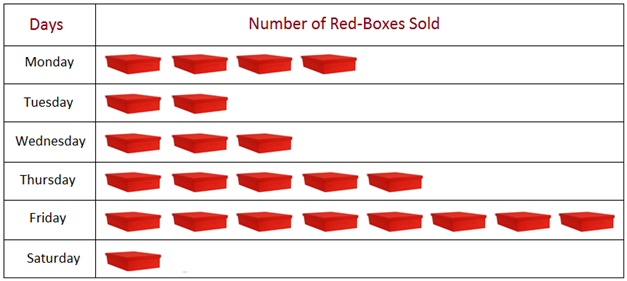
1. Number of red colored boxes sold by William, a shopkeeper, in six days of a week. See the picture graph or pictograph to answer the questions.
Information gathered from the above table:
(i) Number of red boxes sold:
Monday – 4, Tuesday – 2, Wednesday – 3, Thursday – 5, Friday – 8, Saturday – 1
Therefore, sale during the week = 23
(ii) Lowest sale – on Saturday, only 1 box
was sold.
Maximum sale on Friday is 8 boxes were sold.
We can easily get more information by observing this picture-graph.
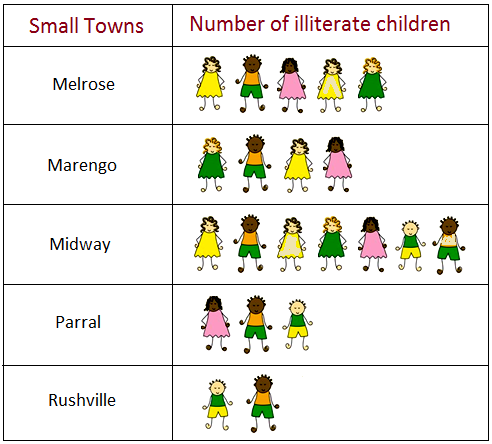
2. Number of illiterate children of 5 small towns, Melrose, Marengo, Midway, Parral and Rushville. See the picture graph or pictograph to answer the questions.
Information gathered from the above table:
(i) Number of illiterate children of different small towns:
Melrose - 5, Marengo - 4, Midway - 7, Parral - 3 and Rushville - 2
(ii) Total number of illiterate = 21
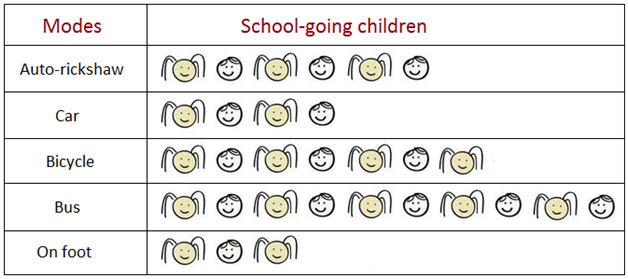
3. Information about 300 children of a school who come to school by different modes of transportation.
See the picture graph or pictograph to answer the questions.
Information gathered from the above table:
(i) Number of students going to school by different modes of transportation:
Auto-rickshaw = 6 × 10 = 60, Car = 4 × 10 = 40, Bicycle = 7 × 10 = 70, Bus = 10 × 10 = 100, On foot = 3 × 10 = 30
(ii) Total number = 60 + 40 + 70 + 100 + 30 = 300
The above explanation on the examples of pictographs or pictorial representation will help us to solve different types of questions on pictograph.
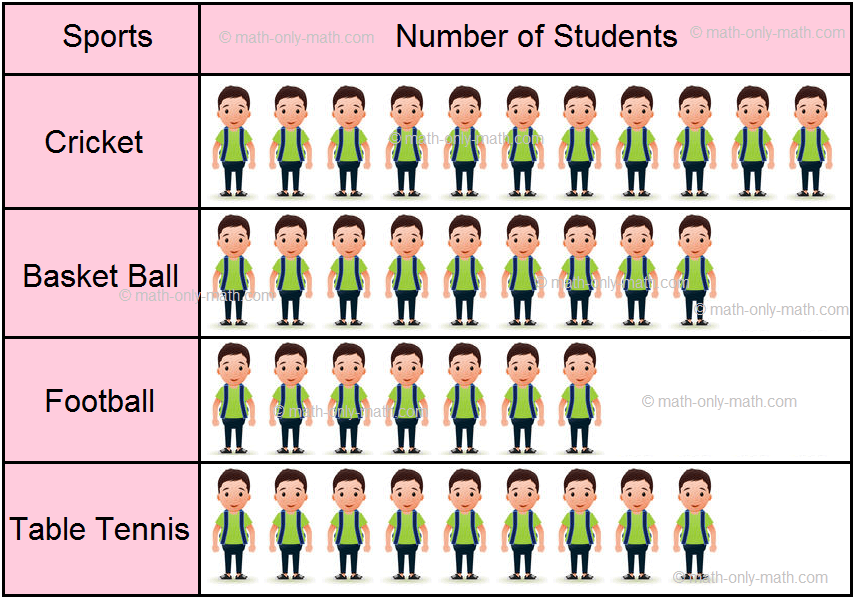
4. The following pictograph shows the favourite sports of students in a class.
On the basis of pictograph, let us answer following questions:
|
Questions (i) How many students are there in the class? |
Answers 36 students |
|
(ii) Which two sports show equal number of students? |
Basketball and Table Tennis |
|
(iii) Which sport has maximum number of students? |
Cricket |
|
(iv) Which sport has least number of students? |
Table Tennis |
Representation of the given information by drawing pictures is called pictograph.
Read the given pictograph and answer the following questions.
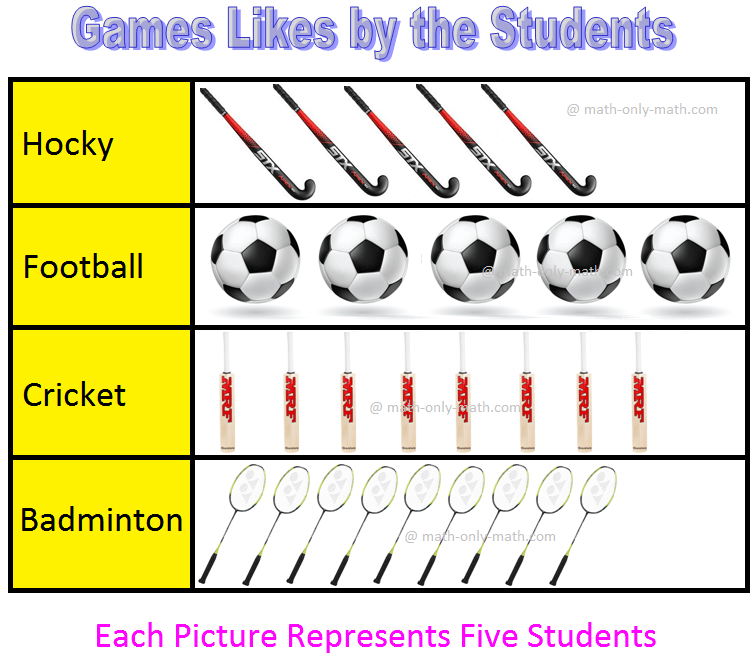
5. The following pictograph shows the games liked by the students of a class.
Use this pictograph to answer the following questions.
(i)) How many students like playing hockey?
(ii) Which is the least liked game?
(iii) How many students like playing cricket?
(iv) Calculate the total number of students.
(v) How many fewer students like football than badminton?
Solution:
(i) 30 students
(ii) Football
(iii) 40 students
(iv) Hockey = 6 × 5=30 students.
Football = 5 × 5 = 25 students.
Cricket = 8 × 5 = 40 students.
Badminton = 9 × 5 = 45 students.
Total Students = 30 + 25 + 40 + 45 = 140 students.
(v) 45 - 25 = 20 students.
Questions and Answers on Examples on Pictographs:
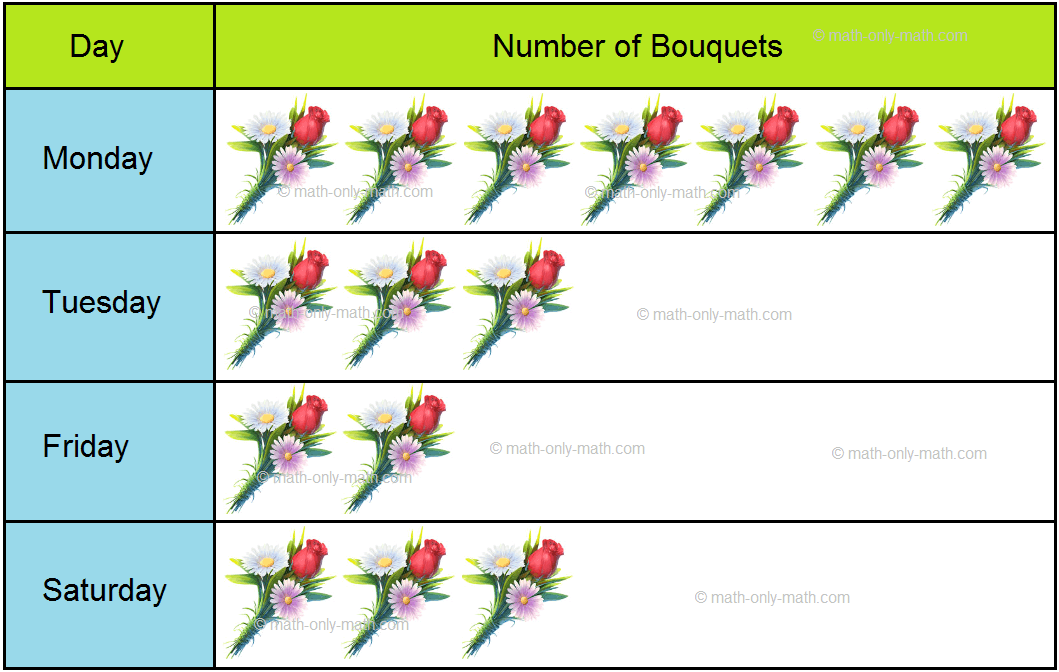
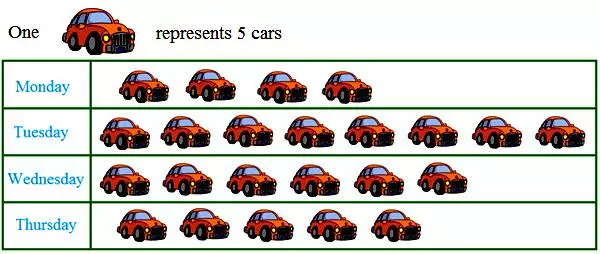
1. The following pictograph shows the sales of bouquets on 4 different days in a week.
On the basis of pictograph, answer the following questions:
(i) Which day of the week bouquets were sold maximum?
(ii) Which day sales were least?
(iii) How many bouquets were sold on Monday and Saturday together?
(iv) How many bouquets were sold on Tuesday and Friday together?
(v) How many bouquets were sold in all?
Answer:
1. (i) Monday
(ii) Friday
(iii) 10
(iv) 5
(v) 15
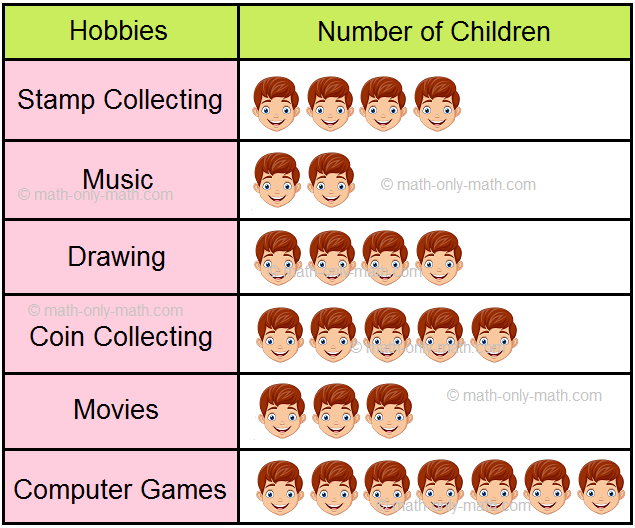
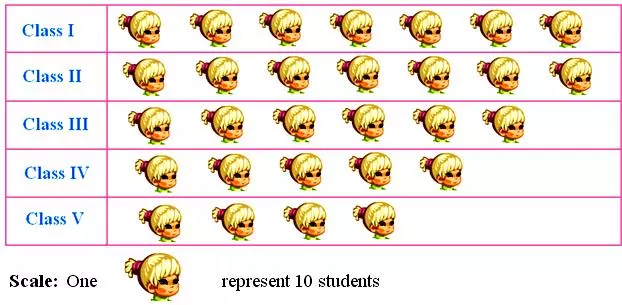
2. The number of children in a society with different hobbies is shown below.
Look at the pictograph and answer the questions.
(i) Which is the most popular hobby?
(ii) Which is the least popular hobby?
(iii) Which two hobbies are equally popular?
(iv) How many children are there in the society?
(v) How many hobbies they have in all?
Answer:
2. (i) Computer Games
(ii) Music
(iii) Stamp collecting and drawing
(iv) 48
(v) 6
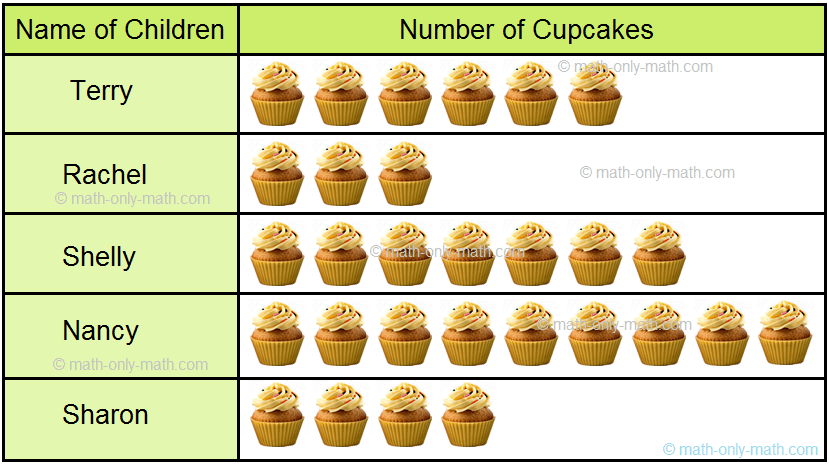
3. Number of cupcakes given to 5 children are given below. Prepare a pictograph of the given data. Also, label its parts.
Name of Children
Terry
Rachel
Shelly
Nancy
Sharon
Number of Cupcakes
6
3
7
9
4
|
Name of the Child |
Number of Cupcakes |
|
____________________ |
____________________ |
|
____________________ |
____________________ |
|
____________________ |
____________________ |
|
____________________ |
____________________ |
|
____________________ |
____________________ |
3. Answer:
The above examples will help us to understand how to represent the data using pictograph.
Related Concepts
From Examples of Pictographs to HOME PAGE
Didn't find what you were looking for? Or want to know more information about Math Only Math. Use this Google Search to find what you need.
Recent Articles
-
Adding 1-Digit Number | Understand the Concept one Digit Number |Video
Mar 07, 25 03:55 PM
Understand the concept of adding 1-digit number with the help of objects as well as numbers. -
Vertical Addition | How to Add 1-Digit Number Vertically? | Problems
Mar 07, 25 02:35 PM
Now we will learn simple Vertical Addition of 1-digit number by arranging them one number under the other number. How to add 1-digit number vertically? -
13 Times Table | Read and Write Multiplication Table of 13|Times Table
Mar 07, 25 02:33 PM
In 13 times table we will learn how to read and write multiplication table of 13. We read thirteen times table as: One time thirteen is 13 Two times thirteen are 26 Three times thirteen are 39 -
Division of Whole Numbers |Relation between Dividend, Divisor Quotient
Mar 05, 25 03:36 PM
Relation between Dividend, Divisor, Quotient and Remainder is. Dividend = Divisor × Quotient + Remainder. To understand the relation between dividend, divisor, quotient and remainder let us follow the… -
Multiplication of Whole Numbers | Whole Numbers|Multiplication|Numbers
Mar 05, 25 03:29 PM
Multiplication of whole numbers is the sort way to do repeated addition. The number by which any number is multiplied is known as the multiplicand. The result of the multiplication is known as the pro…













New! Comments
Have your say about what you just read! Leave me a comment in the box below. Ask a Question or Answer a Question.