Pictograph to Represent The Collected Data
Pictures or symbols are made in a pictograph to represent the collected data. So, we can say that a pictograph represents the data and gives information quickly and clearly.
Pictorial representation of data:
Representation of numerical data through pictures or graphs is called pictorial representation of data.
Such representation is useful for the purpose of quick and clear understanding and also for making comparisons.
The same type of pictures or symbols is used to represent or number of objects.
The symbols are clear and self explanatory. The quantity that each symbol represents is indicated clearly in the representation.
It is helpful to have a picture stand for more than one item as we are able to show large number.
A pictograph has a title and is labeled.
A key is necessary to understand the information given.
The symbol used is simple and self explanatory.
It enables us to compare at a glance, the category which is most popular/least popular.
Here are some examples of forming pictograph with the help of collected data:
1. In a school the number of students class wise are as given below:
Make a pictograph to represent the above data.

(Two columns, one for class and the other for number of students, are made. For the number of students, the column is wide.)
There
are five rows for the classes I to V. A scale is fixed: One face is
taken to represent 10 students. So, for 70 students of class I, 7 faces
are made. For Class II also 7 faces are made for 70 students. For 60
students of class III there are 6 faces. For 50 students of class IV 5
faces and for 40 students of class V there are 4 faces.
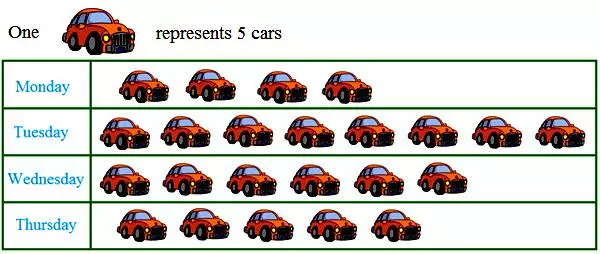
2.
A bookseller sold 60 books on Monday, on Tuesday 50 books, on Wednesday
80 books, on Thursday 40 books, on Friday 40 books and on Saturday 70
books. Draw a pictograph for the books sold during the week.
Solution:

For six days six rows are made.

In front of Monday there are 6 books, in front of Tuesday 5 books, in
front of Wednesday 8 books, in front of Thursday and Friday 4 books in
each row and in front of Saturday there are 7 books.
Thus, the pictograph is formed.
3. In the following table there is given the number of women who use cosmetics in a city in different years. Represent the above data by pictograph.
Solution:
Pictograph of numerical data of women using cosmetics

4. A fruit seller sold the following number of different fruits
as given below. Form a pictograph with the help of the given data.
Solution:
1 fruit represents 10 fruits

The above examples on pictograph to represent the collected data.
You might like these
Worksheet on Pictographs | Picture Graph Worksheets | Pictograph Works
In worksheet on pictographs, all grade students can practice the questions on data handling. We can present the given information in many ways. In pictograph the information is presented by using a picture as symbol. A pictograph has a title and a key.
Pictographs | Pictorial Representation | Pictorial Symbols | Symbols
In pictographs we learnt to recognize different things in our surroundings and to express the given information through pictorial symbols of different objects.
Interpreting a Pictograph | Information Regarding the Pictograph |Math
In interpreting a pictograph, we get a lot of information regarding the pictograph items. The following examples may illustrate the interpretation of pictographs.
Data Handling | Data Analysis | Data Processing | Numerical Data | Def
In data handling we will learn how to do data analysis or data processing while handling data in mathematics. What is data handling in math? In various fields, we need information
Worksheet on Data Handling | Questions on Handling Data |Grouping Data
In math practice worksheet on data handling we will solve numerous types of questions on handling data, frequency distribution and on grouping data. Questions on frequency distribution
Worksheet on Bar Graphs | Bar Graphs or Column Graphs | Graphing Bar
In math worksheet on bar graphs students can practice the questions on how to make and read bar graphs or column graphs. Test your knowledge by practicing this graphing worksheet where we will
Worksheet on Pie Chart | Questions on Pie Graphs | Creating Pie Chart
In math worksheet on pie chart students can practice different types of questions on pie graphs. From the given data we need to calculate the central angle of the components to construct the questions
Construction of Bar Graphs | Examples on Construction of Column Graph
Now we will discuss about the construction of bar graphs or column graph. In brief let us recall about, what is bar graph? Bar graph is the simplest way to represent a data. In consists of rectangular bars of equal width. The space between the two consecutive bars must be
Construction of Pie Chart | Steps of Construction | Solved Examples
The pie chart is a pictorial representation of data relative to a whole. Each portion in the circle represent an element of the collected data. The pie chart represents the composition of various elements in a whole. The total value of the pie chart is always 100%.
Pictorial Representation |Pictograph Worksheet |Representation of Data
Some basic ideas of pictorial representation or pictograph, often related types of symbols or pictures are used to represent a specific number of objects.
Examples of Pictographs |Pictorial Representation|Pictograph Questions
Some sample examples of pictographs or pictorial representation are shown, how the objects are used to give information regarding mathematical data. Read the pictograph and gather the information
5th Grade Bar Graph | Definition | Interpret Bar Graphs|Free Worksheet
We learn how to represent the data on the bar graph. Data can be represented by bars (like rectangle) whose lengths represent numerical values. One can use horizontal or vertical bars. Instead of rectangles one way even use line segments in such graphs.
Interpreting Bar Graph | How to Read a Bar Graph? |Reading a Bar Graph
We will learn interpreting bar graph collecting the given information. Now let us interpret a bar graph. Observe the following bar graph representing the number of students wearing different
2nd Grade Data Handling | Collection of Objects |Information Collected
We have learnt, that a collection of objects can be stored out based on their color, shape, size or any other common thing among them. We can organise all the information in a table to understand how many of each item is there in a collection. Information collected is called


Related Concepts on Data Handling
● Pictograph to Represent The Collected Data
From Pictograph to Represent The Collected Data to HOME PAGE
Didn't find what you were looking for? Or want to know more information about Math Only Math. Use this Google Search to find what you need.

Recent Articles
-
Divisible by 2 | Test of Divisibility by 2 |Rules of Divisibility by 2
Mar 17, 25 04:04 PM
 A number is divisible by 2 if the digit at unit place is either 0 or multiple of 2. So a number is divisible by 2 if digit at its units place is 0, 2, 4, 6 or 8.
 -
Worksheet on 7 Times Table | Printable Multiplication Table | Video
Mar 17, 25 02:41 PM
 Printable worksheet on 7 times table can be used from everywhere. Homeschoolers can also use these multiplication table sheets to practice at home.
 -
Worksheet on 6 Times Table | Printable Multiplication Table | Video
Mar 16, 25 03:09 PM
 Printable worksheet on 6 times table can be used from everywhere. Homeschoolers can also use these multiplication table sheets to practice at home.
 -
Worksheet on 5 Times Table | Printable Multiplication Table | Video
Mar 16, 25 01:25 PM
 Printable worksheet on 5 times table can be used from everywhere. Homeschoolers can also use these multiplication table sheets to practice at home.
 -
Worksheet on 3 Times Table | Printable Multiplication Table | Video
Mar 16, 25 12:59 PM
 Printable worksheet on 3 times table can be used from everywhere. Homeschoolers can also use these multiplication table sheets to practice at home.
New! Comments
Have your say about what you just read! Leave me a comment in the box below. Ask a Question or Answer a Question.