Worksheet on Representing Data on Bar Graph
Practice the questions given in the worksheet on representing data on bar graph.
I. If ⊗ represents 5 book, what do the following represent?
(i) ⊗⊗⊗
(ii) ⊗⊗⊗⊗⊗
(iii) ⊗⊗⊗⊗
(iv) ⊗⊗⊗⊗⊗⊗
(v) ⊗⊗⊗⊗⊗⊗⊗⊗
(vi) ⊗⊗⊗⊗⊗⊗⊗
(vii) ⊗⊗⊗⊗⊗⊗⊗⊗⊗
II. If ⊠ represents 8 pencils, what do the following represent?
(i) ⊠ ⊠
(ii) ⊠ ⊠ ⊠
(iiii) ⊠ ⊠ ⊠ ⊠ ⊠
(iv) ⊠ ⊠ ⊠ ⊠ ⊠ ⊠
(v) ⊠ ⊠ ⊠ ⊠ ⊠ ⊠ ⊠ ⊠ ⊠
(vi) ⊠ ⊠ ⊠ ⊠ ⊠ ⊠ ⊠ ⊠
(vii) ⊠ ⊠ ⊠ ⊠ ⊠ ⊠
III. Avinash collected the following data about the number of latecomers in his class in different days of a week.
Draw a bar graph to represent the above data.
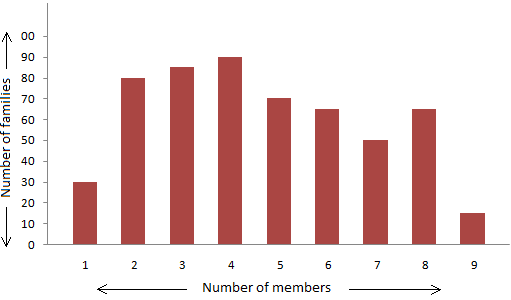
IV. Observe the bar graph, given below, representing the number of families with different number of members in a locality and answer the following equations.
(i) Write the number of families having 6 members.
(ii) How many families are there with the maximum number of members?
(iii) How many families have the minimum number of members?
(iv) How many families have 2 members?
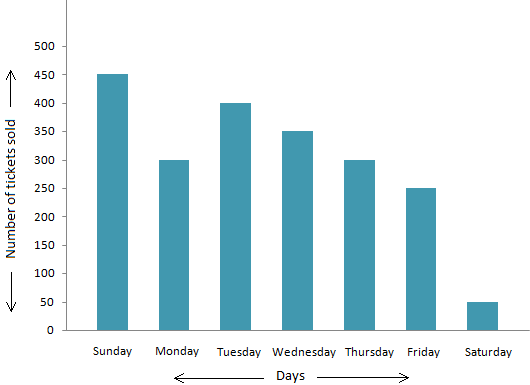
V. Observe the bar graph representing the number of tickets sold in the noon show of a movie in different days of a week and answer the following.
(i) On which day were the maximum tickets sold and how many?
(ii) On which day were the minimum tickets sold and how many?
(iii) On which day were 350 tickets sold?
(iv) On which day were the equal number of tickets sold and how many?
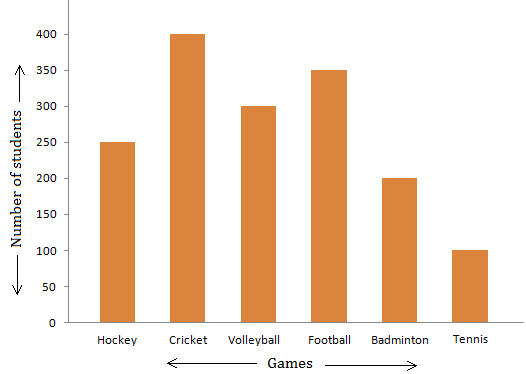
VI. Examine the bar graph representing the number of students, interested in different games, in a school and answer the following questions.
(i) In which game maximum students are interested and how many?
(ii) In which game minimum students are interested and how many?
(iii) How many students are interested in Hockey?
(iv) Which is the next most popular game among the students after cricket?
VII. Ramesh collected the following information about the number of books in different subjects in his school library.
Draw a horizontal bar graph and answer the following questions.
(i) In which subject has the maximum number of books?
(ii) In which subject has the minimum number of books?
(iii) How many computer books are there in the library?
(iv) What is the total number of books in the library?
VIII. If ∎ represents 7 mangos and Ψ represent 4 apples, what do the following represent?
(i) ∎Ψ ∎Ψ
(ii) ∎Ψ ∎Ψ ∎Ψ ∎Ψ
(iii) ∎Ψ ∎Ψ ∎Ψ
(iv) ∎Ψ ∎Ψ ∎Ψ ∎Ψ ∎Ψ ∎Ψ
(v) ∎Ψ ∎Ψ ∎Ψ ∎Ψ ∎Ψ
(vi) ∎Ψ ∎Ψ ∎Ψ ∎Ψ ∎Ψ ∎Ψ ∎Ψ ∎Ψ
(vii) ∎Ψ
(viii) ∎Ψ ∎Ψ ∎Ψ ∎Ψ ∎Ψ ∎Ψ ∎Ψ ∎Ψ ∎Ψ ∎Ψ
Answers for the worksheet on representing data on bar graph are given below.
Answers:
I. (i) 15 books
(ii) 25 books
(iii) 20 books
(iv) 30 books
(v) 40 books
(vi) 35 books
(vii) 45 books
II. (i) 16 pencils
(ii) 32 pencils
(iii) 40 pencils
(iv) 56 pencils
(v) 72 pencils
(vi) 64 pencils
(vii) 48 pencils
III.
IV. (i) 65
(ii) 15
(iii) 30
(iv) 80
V. (i) Sunday, 450 tickets
(ii) Saturday, 200 tickets
(iii) Wednesday
(iv) Monday and Thursday, 300 tickets
VI. (i) Cricket, 400 students
(ii) Tennis, 100 students
(iii) 250students
(iv) Football
VII. (i) English
(ii) Science
(iii) 450
(iv) 2625
VIII. (i) 14 mangoes, 8 apples
(ii) 28 mangoes, 16 apples
(iii) 21 mangoes, 12 apples
(iv) 42 mangoes, 24 apples
(v) 35 mangoes, 20 apples
(vi) 56 mangoes, 32 apples
(vii) 7 mangoes, 4 apples
(viii) 70 mangoes, 40 apples
4th Grade Math Worksheets
From Worksheet on Representing Data on Bar Graph to HOME PAGE
Didn't find what you were looking for? Or want to know more information about Math Only Math. Use this Google Search to find what you need.
Recent Articles
-
BODMAS Rule | Order of Operation | Definition, Examples, Problems
Mar 28, 25 02:17 AM
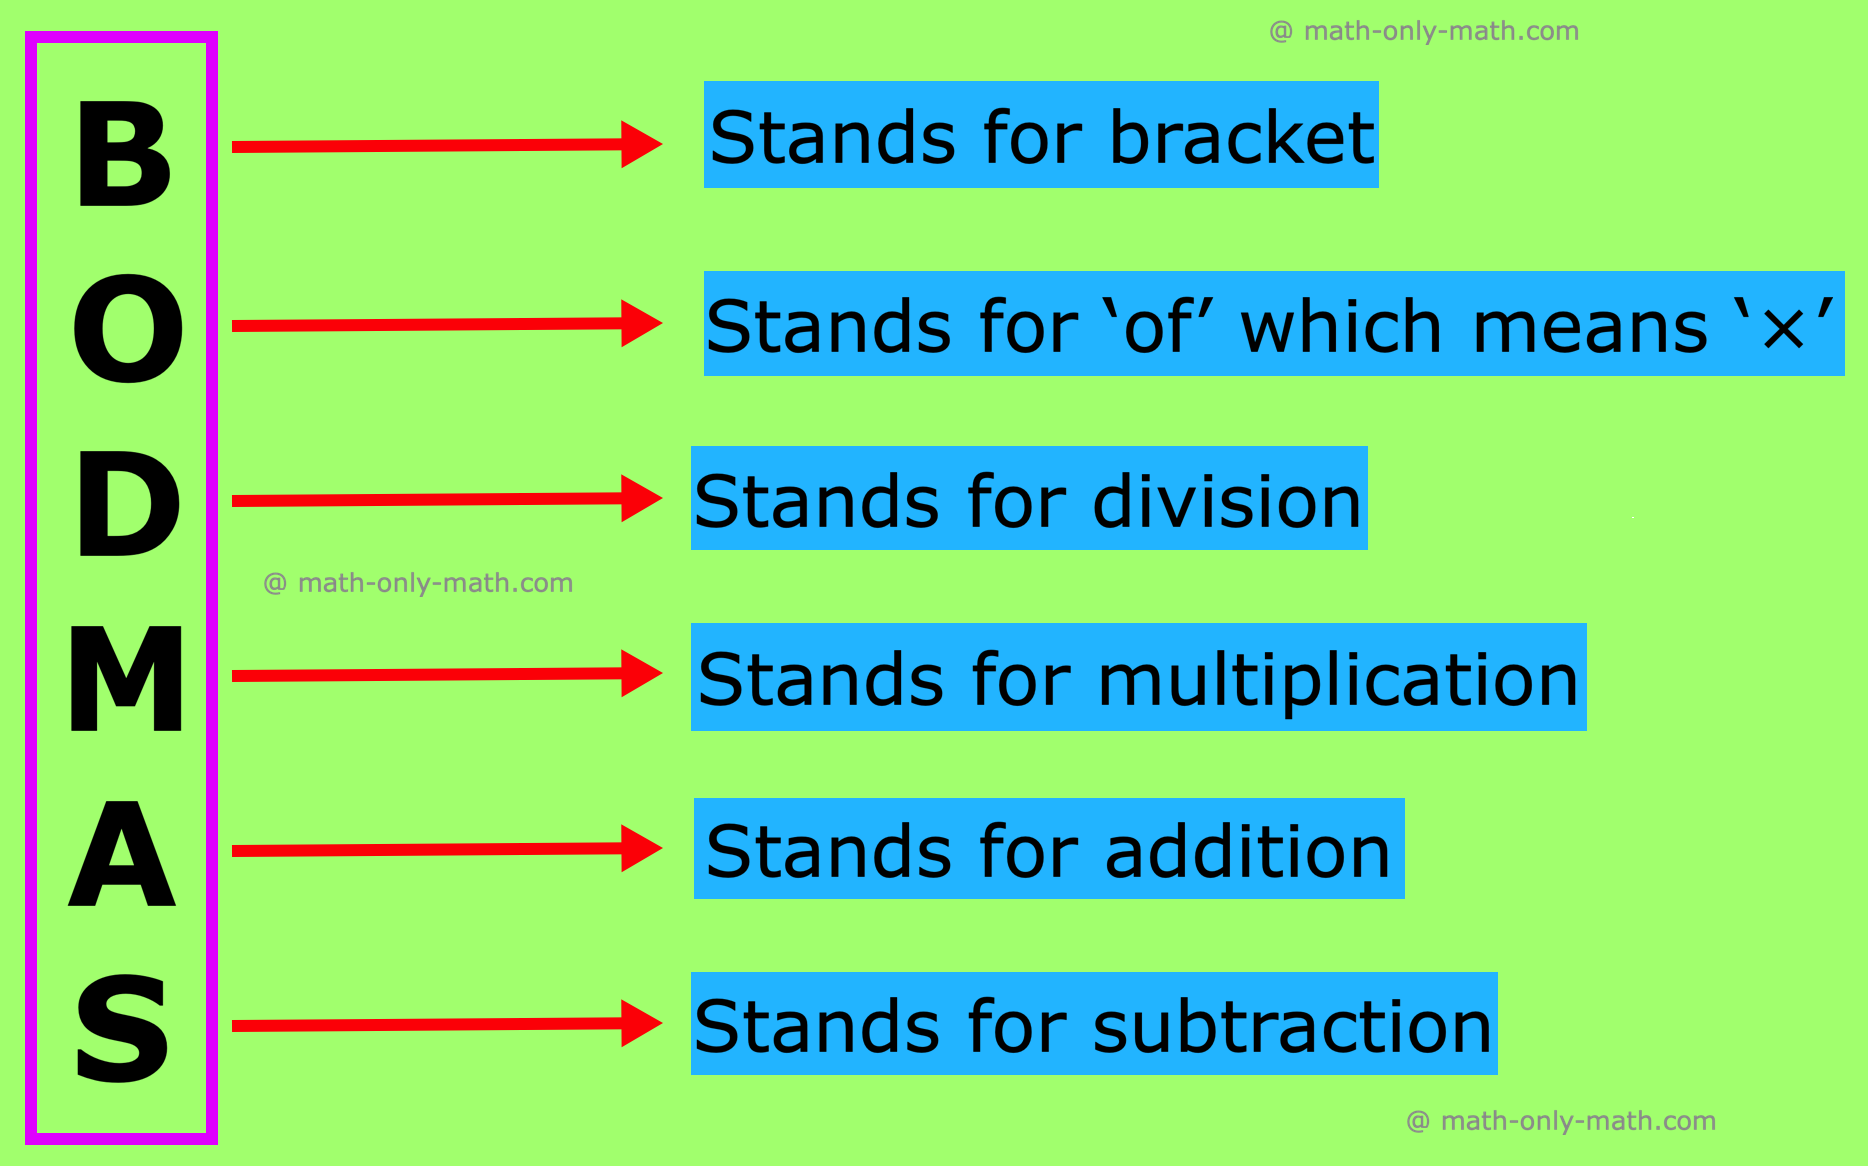
Easy and simple way to remember BODMAS rule!! B → Brackets first (parentheses) O → Of (orders i.e. Powers and Square Roots, Cube Roots, etc.) DM → Division and Multiplication -
Divisibility Rules From 2 to 18 | Math Divisibility Test | Videos |
Mar 27, 25 01:04 PM
To find out factors of larger numbers quickly, we perform divisibility test. There are certain rules to check divisibility of numbers. Divisibility tests of a given number by any of the number 2, 3, 4… -
Divisible by 2 Video |Test of Divisibility by 2 Trick| Rules| Examples
Mar 27, 25 11:10 AM
A number is divisible by 2 if the digit at unit place is either 0 or multiple of 2. So a number is divisible by 2 if digit at its units place is 0, 2, 4, 6 or 8. -
Divisible by 3 | Test of Divisibility by 3 Trick | Rules | Video
Mar 27, 25 11:01 AM
A number is divisible by 3, if the sum of its all digits is a multiple of 3 or divisibility by 3. Consider the following numbers to find whether the numbers are divisible or not divisible by 3: (i) 54… -
Divisible by 4 | Test of Divisibility by 4 Trick | Rules | Video
Mar 27, 25 11:00 AM
A number is divisible by 4 if the number is formed by its digits in ten’s place and unit’s place (i.e. the last two digits on its extreme right side) is divisible by 4. Consider the following numbers…





New! Comments
Have your say about what you just read! Leave me a comment in the box below. Ask a Question or Answer a Question.