Problems Involving Percentage
We will discuss here how to solve the problems involving percentage.
Everyday life problems involving use of percentage:
1. In an examination of 75 marks, Richard got 60 % marks. How many marks did Richard get?
Richard got 60 % marks = 60/100 = 3/5
60 % of 75 marks = 3/5 × 75 = 15 × 3 = 45
Therefore, Richard got 45 marks.
2. Derek secured 18 marks out of 25 in a test. Express his marks as a percentage.
18 marks out of 25 can be written as 18/25
Therefore, percentage = 18/25 × 100 % = 72 %
3. A man earns $ 450 per month. He spends 70 % of his
income. What does he save every month?
The man spends 70 % of his income.
He save (100 - 70) is 30% of his income.
His saving = 30 % of $ 450
= 30/100 × 450 = $ 135
4. What percentage is 300 g of 2 kg?
2 kg = 2 × 1000 = 2000 g
To find the percentage we write 300 g/2000 g × 100 = 15 %
5. A student has to secure 40 % marks to pass. He gets 50 makes and fails by 30 marks. Find the maximum marks?
The student gets = 50 marks
He fails by 30 marks
The marks required to pass = 50 + 30 = 80
Now we have to find out Maximum marks.
As 40 % of Maximum marks = 80
Maximum marks = 80 × 100/40 = 200.
To Convert a Percentage into a Fraction
To Convert a Fraction into a Percentage
To find the percent of a given number
To find what Per cent is one Number of another Number
To Calculate a Number when its Percentage is Known
Metric measures as Percentages
5th Grade Numbers Page
5th Grade Math Problems
From Problems Involving Percentage to HOME PAGE
Didn't find what you were looking for? Or want to know more information about Math Only Math. Use this Google Search to find what you need.

Recent Articles
-
Basic Multiplication Facts | Repeated Addition |Multiplication Process
Jan 15, 25 12:23 AM
 Some basic multiplication facts are needed to follow for multiplying numbers. The repeated addition of the same number is expressed by multiplication in short.
 -
Properties of Multiplication | Multiplicative Identity | Whole Numbers
Jan 15, 25 12:08 AM
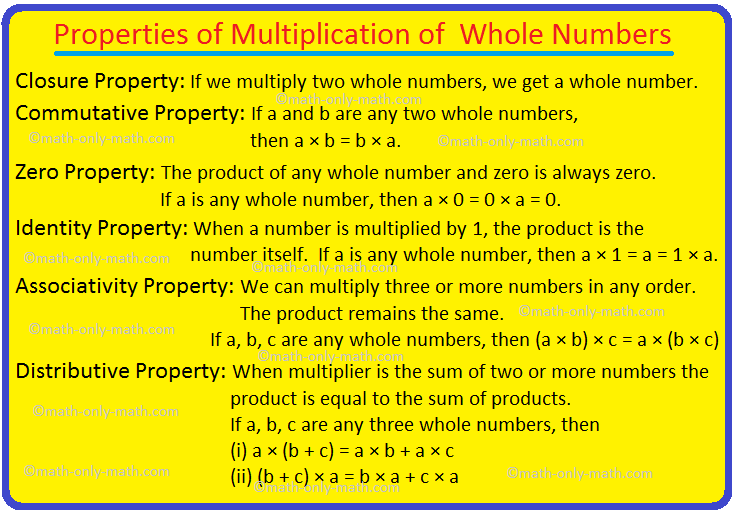 There are six properties of multiplication of whole numbers that will help to solve the problems easily. The six properties of multiplication are Closure Property, Commutative Property, Zero Property…
 -
Multiplication Table | Learn Tables from 0 – 25 | Multiplication Table
Jan 14, 25 11:53 PM
 In math multiplication table we will learn the tables from 0 – 25. These multiplication tables help the students to learn the essential multiplication facts. Multiplication tables are very important f…
 -
3rd Grade Math Worksheets |3rd Grade Math Sheets|3rd Grade Math Lesson
Jan 14, 25 11:02 PM
 3rd grade math worksheets is carefully planned and thoughtfully presented on mathematics for the students. Teachers and parents can also follow the worksheets to guide the students.
 -
3rd Grade Subtraction Worksheet | 3-Digit Subtraction Worksheets | Ans
Jan 14, 25 01:57 PM
 In 3th Grade Addition Worksheet we will solve how to subtract 3-digit numbers by expansion, subtraction of 3-digit numbers without regrouping, subtraction of 3-digit numbers with regrouping, propertie…
New! Comments
Have your say about what you just read! Leave me a comment in the box below. Ask a Question or Answer a Question.