Graph of Simple Interest vs. Number of Years
Here we will learn about the graph of simple interest vs. number of years.
Simple interest on a certain sum is $ 40 per
year.
Then, S = 40 × x, where x is the number of
years.
1. Draw a graph of the above function.
2. From the graph find the value of 5, when
(a) x = 5 (b) x = 6
Solution:
1. The given function is S = 40 ×
x.
Putting x = 1, 2, 3, 4 successively and getting
the corresponding value of S. we get the table given below.
| x | 1 | 2 | 3 | 4 |
|---|---|---|---|---|
| |
Along the x-axis: Take 1 small square = 1 unit.
Along the y-axis: Take 1 small square = 10 units.
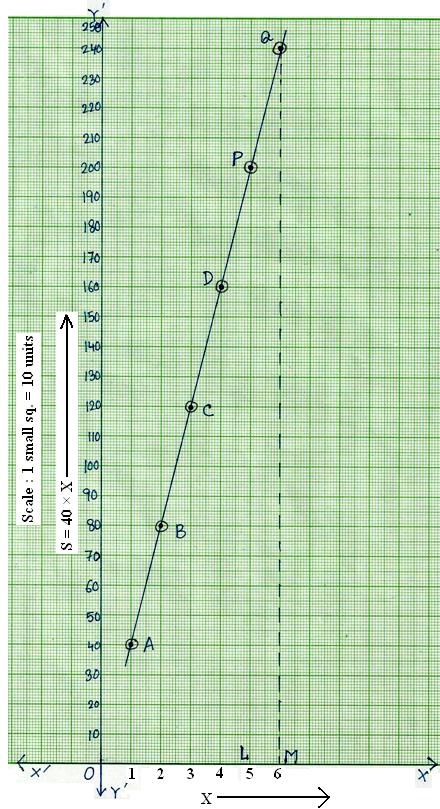
Now, on a graph paper, plot the points
A (1, 40), B (2, 80), C (3, 120) and D (4, 160).
Join them successively to get the required graph
line, shown below.
2. Reading off from the graph of simple interest vs. number of years:
(a) On the x-axis, take the point L at x = 5.
Draw LP ⊥ x-axis, meeting the graph at P.
Clearly, PL, = 200 units.
Therefore, x = 5 ⇒ S = 200.
Thus, when x = 5, then S = 200.
(b) On the x-axis, take the point M at x = 6.
Draw QM ⊥ x-axis, meeting the graph at Q.
Clearly, QM = 240 units.
Therefore, x = 6 ⇒ S = 240.
Thus, when x = 6, then S = 240.
Related Concepts:
● Ordered pair of a Coordinate System
● Find the Coordinates of a Point
● Coordinates of a Point in a Plane
● Plot Points on Co-ordinate Graph
● Simultaneous Equations Graphically
● Graph of Perimeter vs. Length of the Side of a Square
● Graph of Area vs. Side of a Square
7th Grade Math Problems
8th Grade Math Practice
From Graph of Simple Interest vs. Number of Years to HOME PAGE
Didn't find what you were looking for? Or want to know more information about Math Only Math. Use this Google Search to find what you need.
Recent Articles
-
Addition of 4-Digit Numbers | 4-Digit Addition |Adding 4-Digit Numbers
Jan 11, 25 03:16 AM
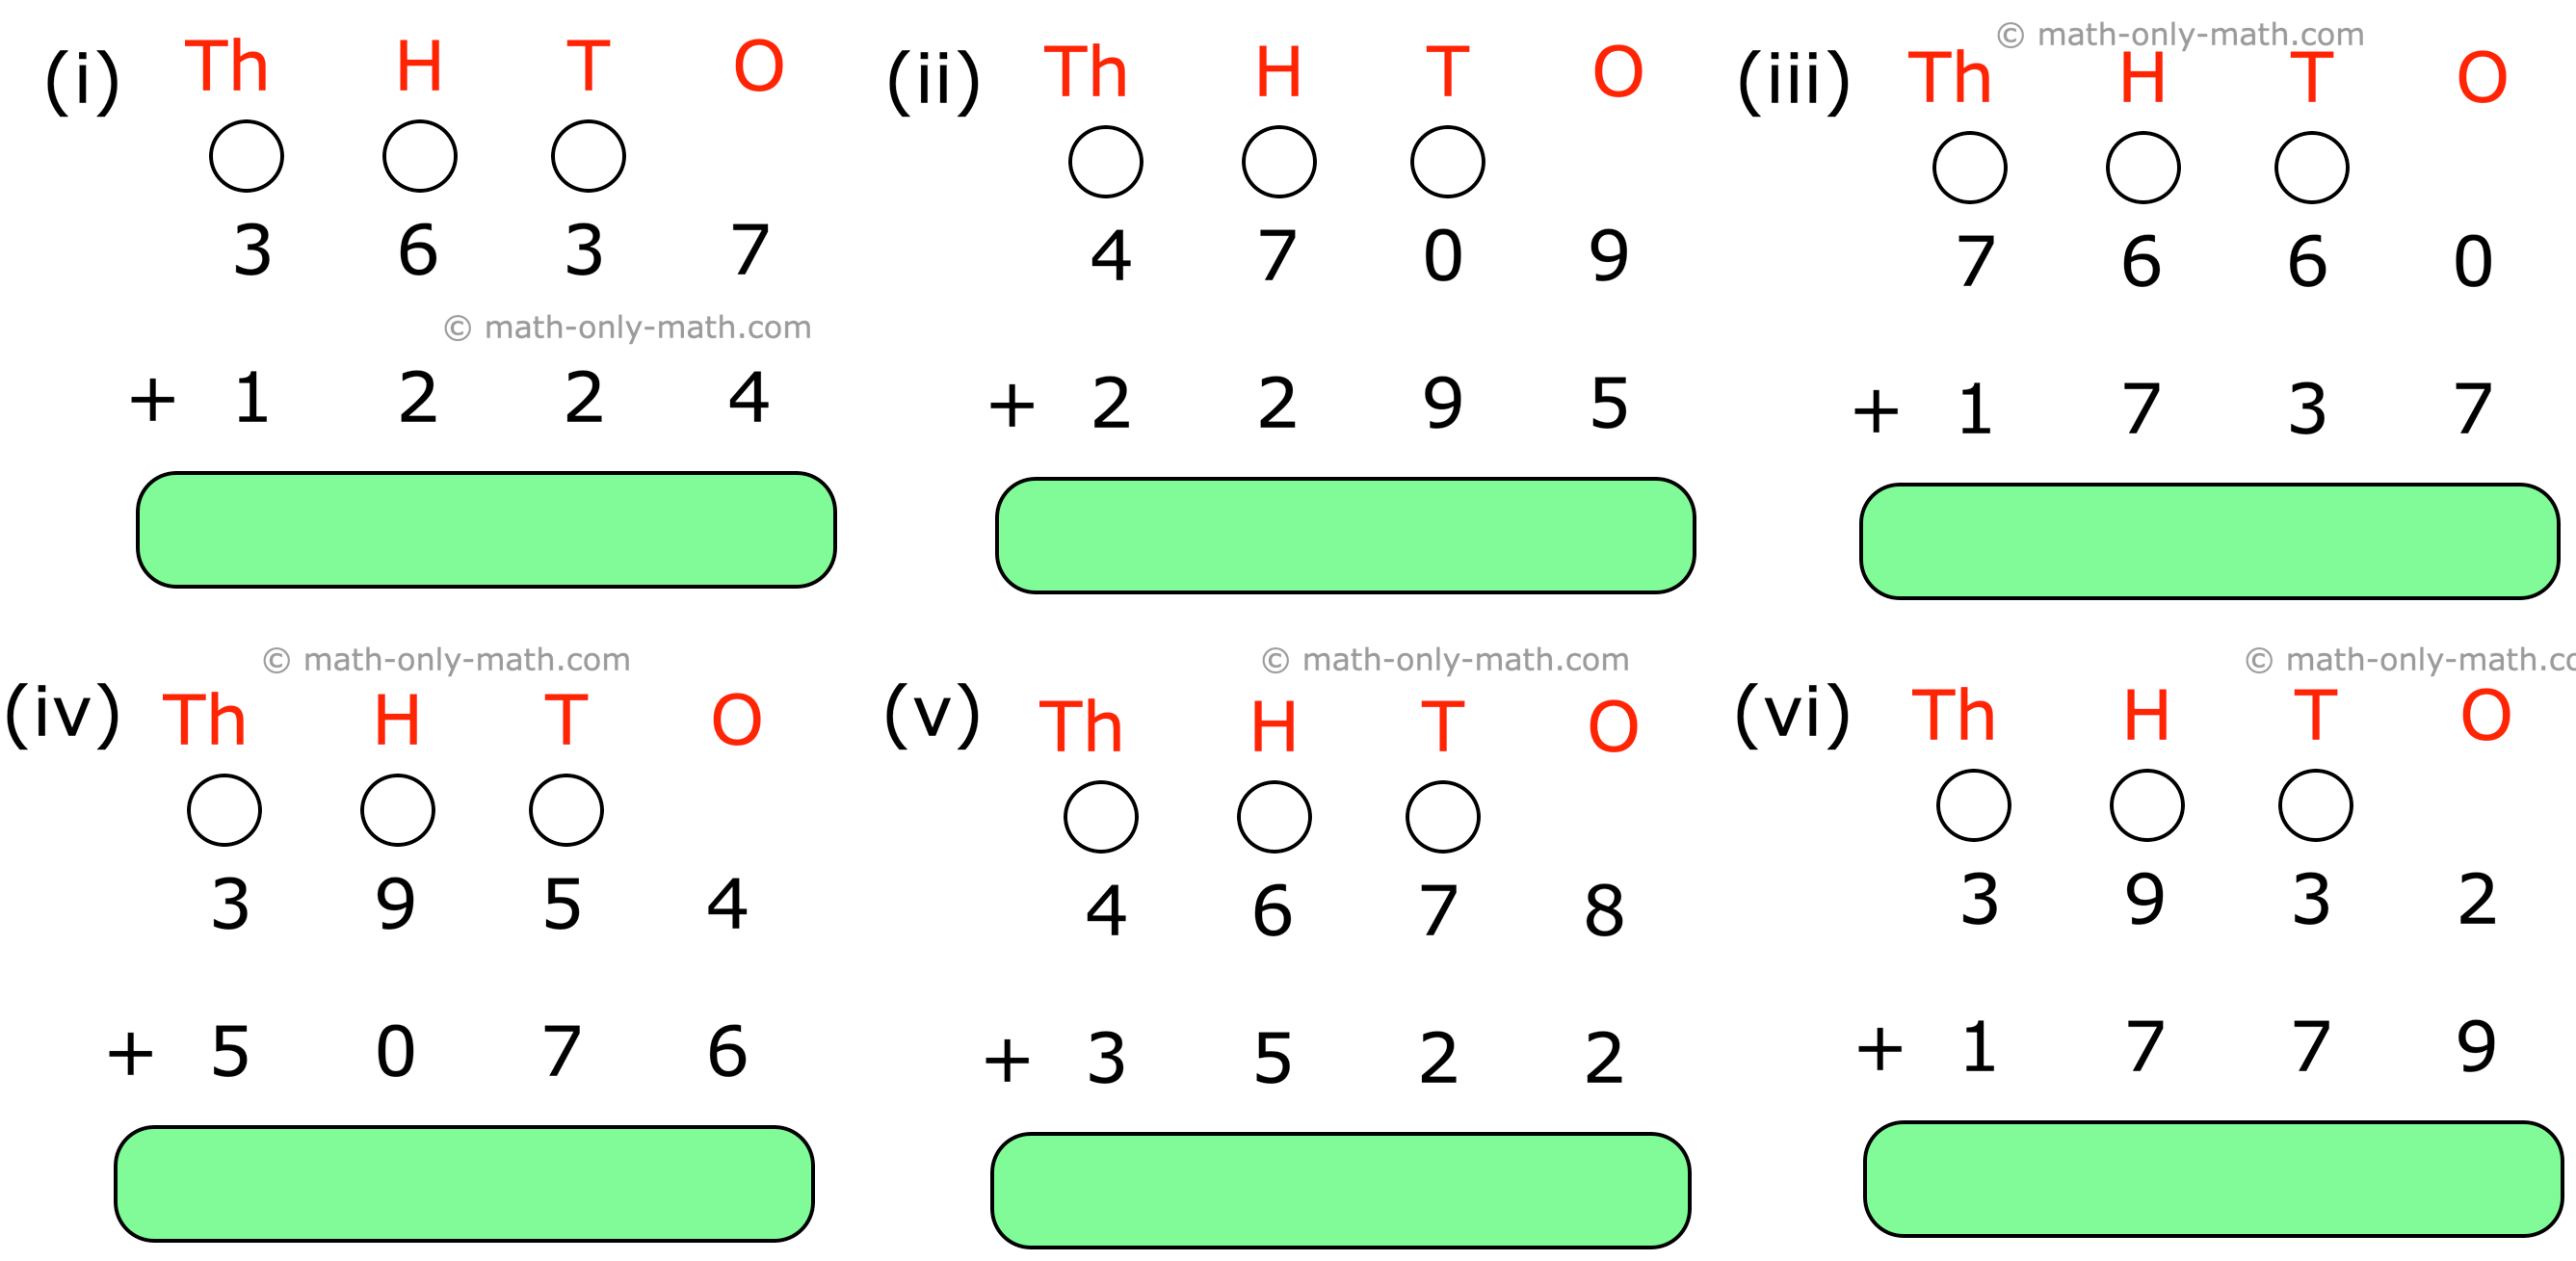
We will learn about the addition of 4-digit numbers (without carrying and with carrying). We know how to add 2 or 3, 3-digit numbers without carrying or with carrying. -
Worksheet on Addition of 4-Digit Numbers | 4 Digit Addition Worksheets
Jan 11, 25 02:48 AM
Practice the questions given in the worksheet on addition of 4-digit numbers. Here we will add two 4-digit numbers (without carrying and with carrying) and three 4-digit numbers -
Word Problems on 4-Digit Numbers |Addition and Subtraction of 4-Digits
Jan 10, 25 02:49 PM
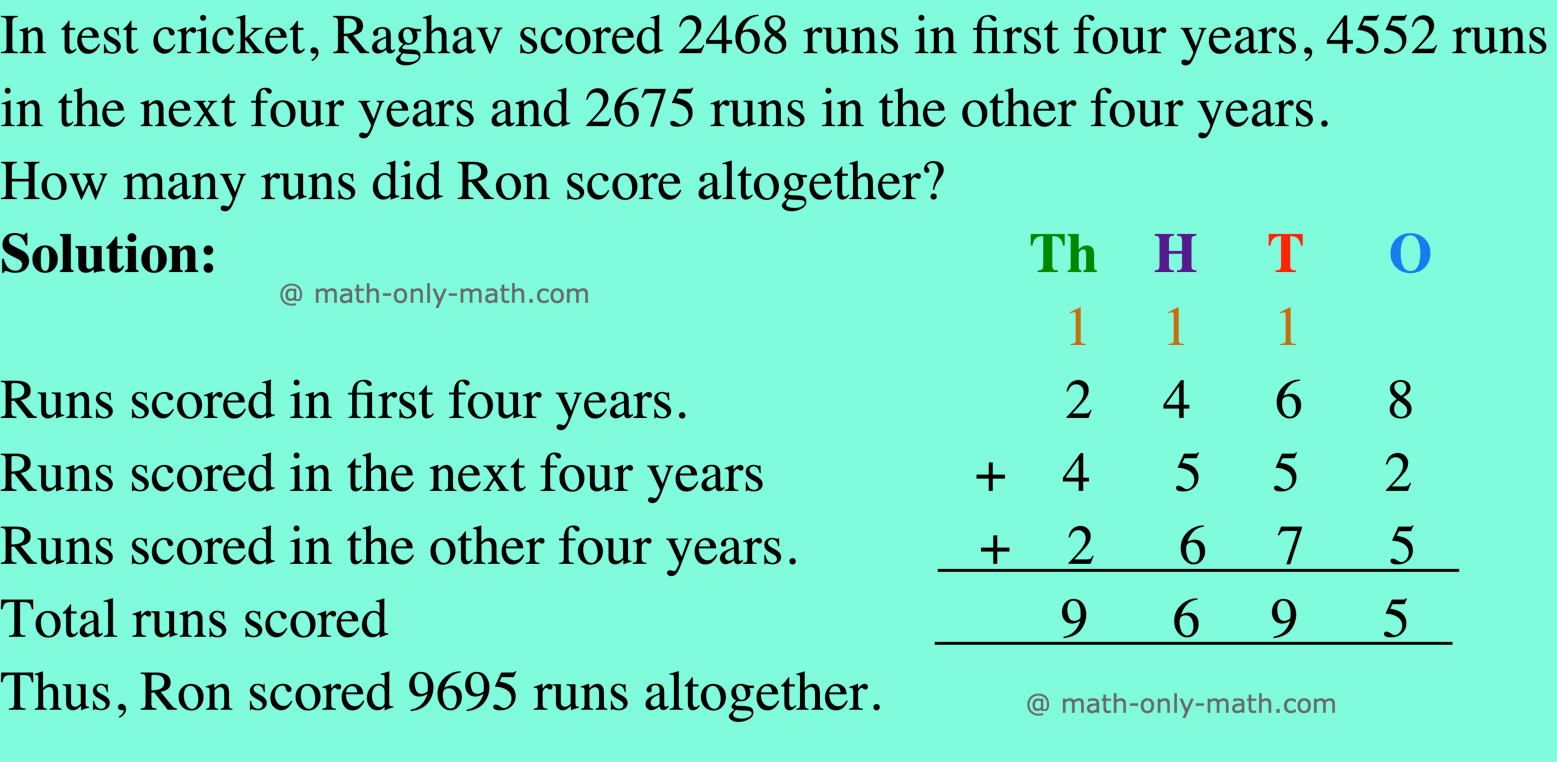
We will solve here some of the word problems on addition and subtraction of 4-digit numbers. We will apply the same method while adding and subtracting the word problems. 1. In a village, there are 25… -
Addition of 10, 100 and 1000 | Adding 10 | Adding 100 | Adding 1000
Jan 10, 25 01:20 AM
Here we will learn Addition of 10, 100 and 1000 with the help of different examples. -
Estimating a Sum | Round the Number | Numbers by Rounding | Estimating
Jan 10, 25 12:10 AM
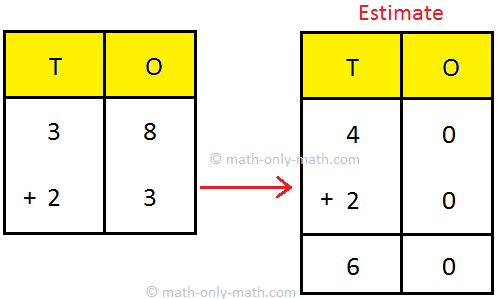
We will learn the basic knowledge for estimating a sum. Here we will learn an easy way to estimate a sum of two numbers by rounding. In case of two digit numbers we can only round the number


New! Comments
Have your say about what you just read! Leave me a comment in the box below. Ask a Question or Answer a Question.