Estimate Median, Quartiles from Ogive
For a frequency distribution, the median and quartiles can be obtained by drawing the ogive of the distribution. Follow these steps.
Step I: Change the frequency distribution into a continuous distribution by taking overlapping intervals. Let N be the total frequency.
Step II: Construct a cumulative-frequency table for the distribution and draw the ogive accordingly by using proper scales of representation.
Step III: For median (i) If N is odd, find \(\frac{N + 1}{2}\), and locate the point F on the y-axis which represents the cumulative frequency \(\frac{N + 1}{2}\).
(ii) If N is even, find the mean A of \(\frac{N}{2}\) and \(\frac{N}{2}\) + 1, which is given by A = \(\frac{1}{2}\){\(\frac{N}{2}\) + (\(\frac{N}{2}\) + 1)}. Locate the point F on the y-axis, which represents the cumulative frequency A.
For lower quartile: Find the integer c just greater than \(\frac{N}{4}\). Locate the point F on the y-axis, which represents the cumulative frequency c.
For upper quartile: Find the integer c just greater than \(\frac{3N}{4}\). Locate the point F on the y-axis, which represents the cumulative frequency c.
Step IV: Draw a line FD parallel to the x-axis to cut the ogive at C.
Step V: Draw a line CM perpendicular to the x-axis (class-interval axis) to cut the ogive at M. The variate represented by M is the median or lower quartile or upper quartile as the case may be.
Solved Problems on Estimate Median, Quartiles from Ogive:
1. Estimate the median, lower quartile and upper quartile for the following distribution.
Class Interval
0 - 10
10 - 20
20 - 30
30 - 40
40 - 50
50 - 60
Frequency
5
3
10
6
4
2
Solution:
Here, the distribution is continuous and total frequency = 30.
For constructing the ogive (step II), the following cumulative-frequency table is constructed.
Class Interval
0 - 10
10 - 20
20 - 30
30 - 40
40 - 50
50 - 60
Frequency
5
8
18
24
28
30
Take the following scales:
On the x-axis (class-interval axis), 1 cm = size 10.
On the y-axis (cumulative –frequency axis), 2 mm = frequency 1 (i.e., frequency of 1 is denoted by 2 mm).
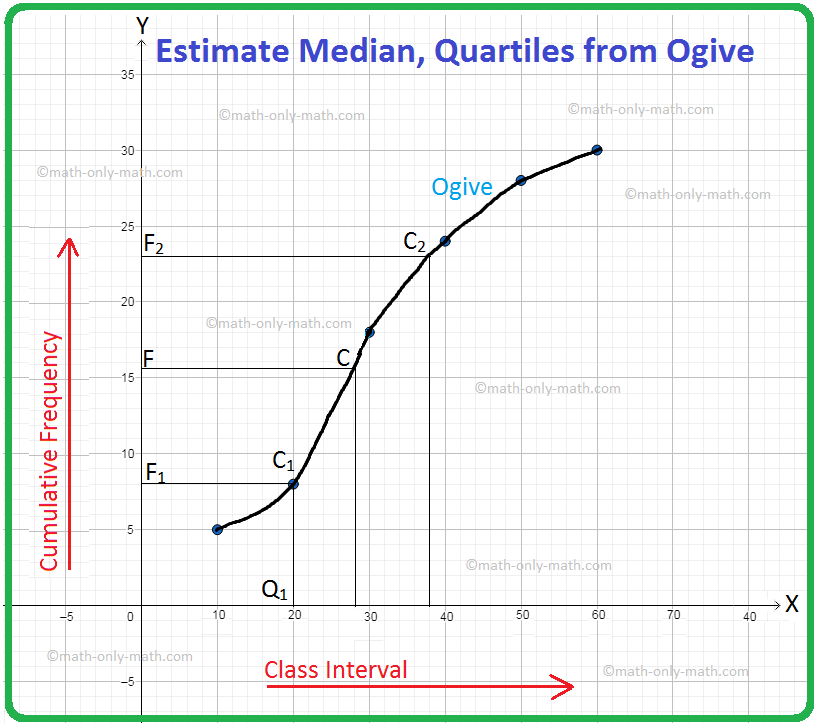
Now, plot the pojnts (10, 5), (20, 8), (30, 18), (40, 24), (50, 28), (60, 30), and join them by a smooth curve to get the ogive.
Here, N = 30 = even. So, the mean of \(\frac{N}{2}\) and \(\frac{N}{2}\) + 1, i.e., the mean of 15 and 16, is 15.5. The point F on the y-axis represents the cumulative frequency 15.5. FC ∥ x-axis is drawn to cut the ogive at C. CM ⊥ x-axis is drawn to cut at M. The point M represents the median. Now, the point M represents the variate 28 on the x-axis.
So, the median is 28.

Now, \(\frac{N}{4}\) = \(\frac{30}{4}\) = 7.5. The integer just greater than 7.5 is 8. The point F1 on the y-axis represents the cumulative frequency 8. F1C1 ∥ x-axis is drawn to cut the ogive at C1. C1Q1 ⊥ x-axis is drawn to cut the ogive at Q1. The point Q1 represents the lower quartile. Now, the point Q1 represents the variate 20. So, the lower quartile is 20.
Next, \(\frac{3N}{4}\) = \(\frac{3 × 30}{4}\) = 22.5. The integer just greater than 22.5 is 23. The point F2 on the y-axis represents the cumulative frequency 23. F2C2 ∥ x-axis is drawn to cut the ogive at C2. C2Q2 ⊥ x-axis is drawn to cut the ogive at Q2. The point Q2 represents the upperr quartile. Now, the point Q2 represents the variate 38. So, the upper quartile is 38.
Note: Thse estimates are generally rough (that is, with marginal error) because the drawing of an ogive is never perfect.
From Estimate Median, Quartiles from Ogive to HOME PAGE
Didn't find what you were looking for? Or want to know more information about Math Only Math. Use this Google Search to find what you need.
Recent Articles
-
Worksheet on Mixed Addition and Subtraction | Questions on Addition
Jan 12, 25 02:14 PM
In worksheet on mixed addition and subtraction the questions involve both addition and subtraction together; all grade students can practice the questions on addition and subtraction together. -
Estimating Sums and Differences | Estimations | Practical Calculations
Jan 12, 25 02:02 PM
For estimating sums and differences in the number we use the rounded numbers for estimations to its nearest tens, hundred, and thousand. In many practical calculations, only an approximation is requir… -
Combination of Addition and Subtraction | Mixed Addition & Subtraction
Jan 12, 25 01:36 PM
We will discuss here about the combination of addition and subtraction. The rules which can be used to solve the sums involving addition (+) and subtraction (-) together are: I: First add -
Checking Subtraction using Addition |Use Addition to Check Subtraction
Jan 12, 25 01:13 PM
We can check subtraction by adding the difference to the smaller number. Since the sum of difference and smaller number is equal to the larger number, subtraction is correct. -
Worksheet on Subtraction of 4-Digit Numbers|Subtracting 4-Digit Number
Jan 12, 25 09:04 AM
Practice the questions given in the worksheet on subtraction of 4-digit numbers. Here we will subtract two 4-digit numbers (without borrowing and with borrowing) to find the difference between them.


New! Comments
Have your say about what you just read! Leave me a comment in the box below. Ask a Question or Answer a Question.