Subscribe to our ▶️ YouTube channel 🔴 for the latest videos, updates, and tips.
Worksheet on Interpreting a Pictograph
In worksheet on interpreting a pictograph, all grade students can practice the questions on pictograph. From this exercise sheet on pictograph we get a lot of information regarding the pictograph items that can be practiced by the students to get more ideas to learn data handling.
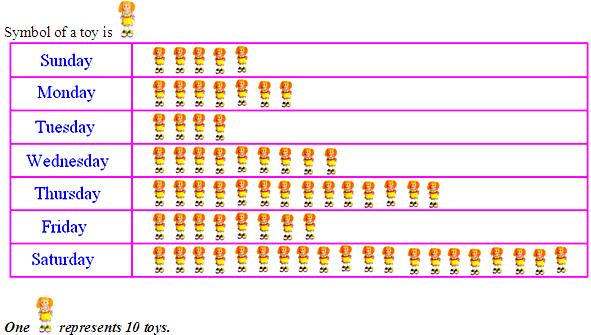
1. The pictograph shows the number of toys sold during the days of a week from a toy shop. Give the following information regarding sale of toys.
(i) Find the number of toys sold on each day of the week.
(ii) Find the number of toys sold during the week.
(iii) On which day were the maximum numbers of toys sold?
(iv) On which day were the minimum numbers of toys sold?
(v) What is the difference in number of toys sold on Saturday and Tuesday?
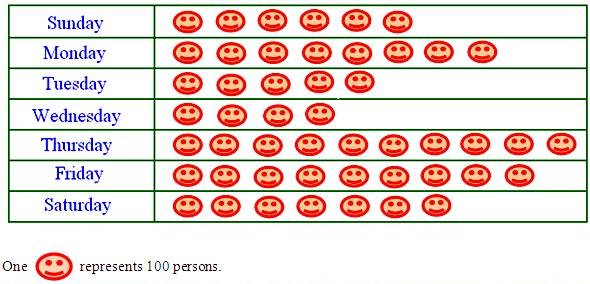
2. The pictograph given below expresses the number of persons who travelled from Varanasi to New Delhi by Shiva Ganga Express on each day of a week.
From the pictograph gather the information and answer the following questions:
(i) How many travelers travelled each day of the week from Varanasi to New Delhi?
(ii) On which day was there maximum rush in the train?
(iii) How many travelers travelled during the week?
(iv) On which day was there minimum rush in the train?
(v) Find the difference between the number of travelers who travelled in maximum and minimum numbers.
3. In the library of a school there are the books on the following subjects in given numbers: English — 100, History — 500, Math — 200, Science — 300
Draw the pictograph of the above numerical data. Find the information on the basis of answers to the given questions.
(i) How many books are there in the library?
(ii) On which subjects are there maximum and minimum number of books?
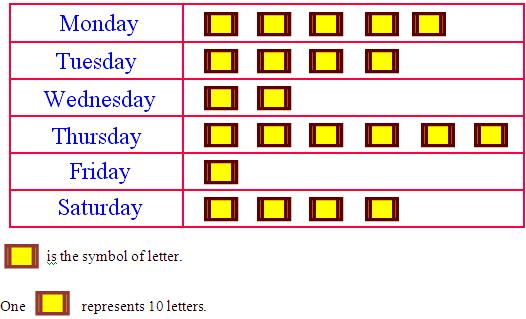
4. The pictograph given below shows the number of letters collected from the post-box in front of my house on each day of a certain week.
(i) On which day were (a) maximum (b) minimum number of letters collected?
(ii) What was the total number of letters collected from the box over the whole week?
(iii) How many more letters were collected on Thursday than Friday?
(iv) How many less letters were collected on Saturday than on Monday?
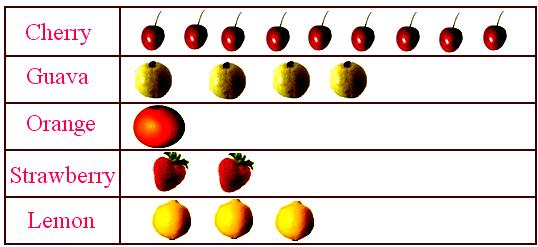
5. In my garden there are cherry, guava, orange, mango and lemon trees. The numbers of these trees are shown in the table in the following page:
Gather at least three pieces of information as expressed by this pictograph regarding the garden.
If students have any queries regarding the questions given in the worksheet on interpreting a pictograph, please contact us so that we can help you.
However, suggestions for further improvement, from all quarters would be greatly appreciated.
● Data Handling - Worksheets
Worksheet on Interpreting a Pictograph.
4th Grade Math Activities
4th Grade Math Worksheets
From Worksheet on Interpreting a Pictograph to HOME PAGE
Didn't find what you were looking for? Or want to know more information about Math Only Math. Use this Google Search to find what you need.


New! Comments
Have your say about what you just read! Leave me a comment in the box below. Ask a Question or Answer a Question.