To Make a Pictograph
How to make a pictograph?
The steps to make a pictograph:
(i) First of all, the related data is collected. For example, to form the pictograph showing the number of boys and girls in different classes and in the school as a whole, the number of boys and girls in different classes are counted.
As, I (35B, 20G), II (30B, 10G), III (10B, 30G), IV (25B, 35G), V (20B, 20G)
[B for boys, G for girls]
(ii) Different symbols are selected for different types of data. As, for the symbol of a boy and a girl, we select a boy’s face and a face with long hair for a girl.
(iii) A framework containing columns and rows is made according to necessity as shown on page 193 of this chapter.
(iv)
The related symbols are made at proper places. The symbol must be
clear, simple and recognizable. They should be self-explanatory.
(v)
One symbol may represent many, i.e., 1, 5, 10, 20, etc., units. The
quantity that each symbol represents is clearly indicated in the
pictograph.
Let us consider an example for representing information by pictographs:
A bus manufacturing company manufactured the following numbers of buses during the first eight months of the year.

From a pictograph based on the information given in the above table and answer the following questions.
(i) What does the pictograph represent?
(ii) In which month did the company manufacture the maximum number of buses?
(iii) In which month was the production minimum?
(iv) What trend do you notice in the monthly production of buses?
(v) In which months is the increase in production of buses stagnant?
Solution:
Let us represent 200 buses by the symbol of one bus as shown below.
We can represent number of buses horizontally and months vertically.

(i) The pictograph formed above represents the number of buses manufactured by the company during the first eight months of the year.
(ii) The product was maximum in the months of July and August.
(iii) The product was minimum in the months of January.
(iv) The pictograph clearly shows an increasing production trend except in the month of August when there is no increases in production.
(v) The increase in production of buses was stagnant in the month of August.
Related Concepts on Data Handling
● Pictograph to Represent The Collected Data
From To Make a Pictograph to HOME PAGE
Didn't find what you were looking for? Or want to know more information about Math Only Math. Use this Google Search to find what you need.

Recent Articles
-
Vertical Subtraction | Examples | Word Problems| Video |Column Method
Mar 22, 25 05:20 PM
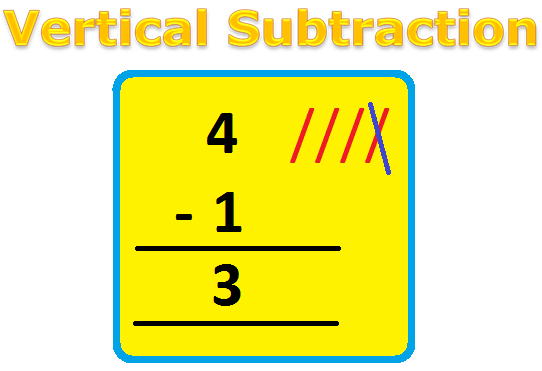 Vertical subtraction of 1-digit number are done by arranging the numbers column wise i.e., one number under the other number. How to subtract 1-digit number vertically?
 -
Worksheet on 11 Times Table | Printable Multiplication Table | Video
Mar 22, 25 05:08 PM
 Worksheet on 11 times table can be printed out. Homeschoolers can also use these multiplication table sheets to practice at home.
 -
Worksheet on 10 Times Table | Printable Multiplication Table | Video
Mar 21, 25 03:46 PM
 Worksheet on 10 times table can be printed out. Homeschoolers can also use these multiplication table sheets to practice at home.
 -
5th Grade Prime and Composite Numbers | Definitions | Examples | Math
Mar 21, 25 12:18 AM
5th grade prime and composite numbers -
14 Times Table | Read and Write Multiplication Table of 14| Video
Mar 20, 25 04:03 PM
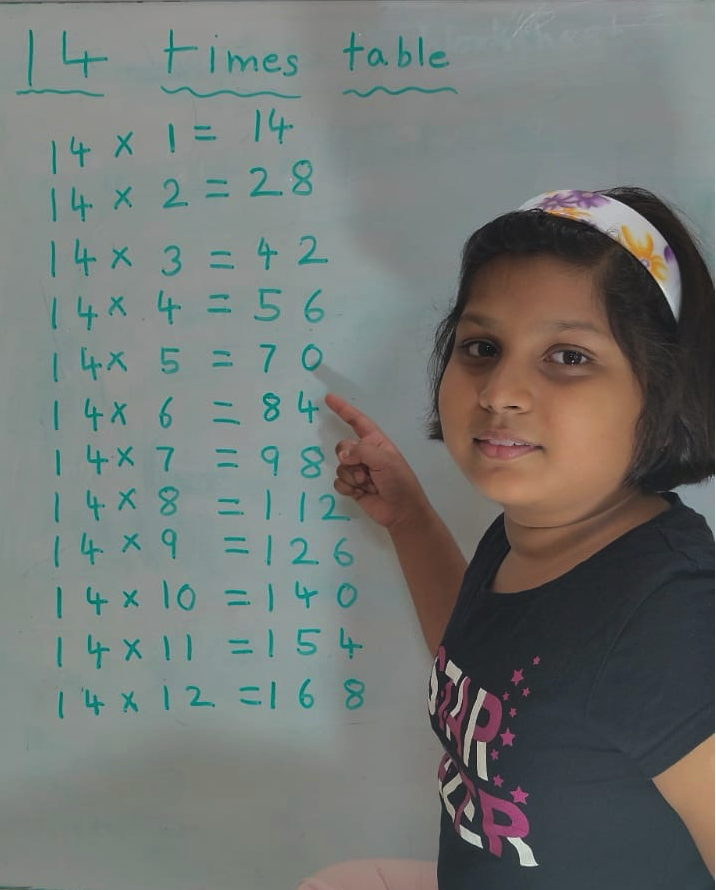 In 14 times table we will learn how to read and write multiplication table of 14. We read fourteen times table as:One time fourteen is 14 Two times fourteen are 28 Three times fourteen are 42
New! Comments
Have your say about what you just read! Leave me a comment in the box below. Ask a Question or Answer a Question.