Sum Of Any Two Sides Is Greater Than Twice The Median
Here we will prove that in a triangle the sum of any two sides is greater than twice the median which bisects the remaining side.
Solution:
Given: In ∆XYZ, XP is the median that bisects YZ at P.

To prove: (XY + XZ) > 2XP.
Construction: Produce XP to Q such that XP = PQ. Join Z and Q.

Proof:
|
Statement |
Reason |
|
1. In ∆XYP and ∆ZPQ, (i) YP = PZ. (ii) XP = PQ (iii) ∠XPY = ∠ZPQ |
1. (i) XP bisects YZ. (ii) By construction. (iii) Vertically opposite angles. |
|
2. XYP ≅ ∆ZPQ |
2. By SAS criterion of congruency. |
|
3. XY = ZQ. |
3. CPCTC. |
|
4. In ∆XZQ, (XZ + ZQ) > XQ. |
4. Sum of the two sides of a triangle is greater than the third side. |
|
5. (XZ + XY) > (XP + PQ). |
5. XY = ZQ, from statement 3. |
|
6. (XY + XZ) > 2 XP. (Proved) |
6. XP = PQ. |
From Sum Of Any Two Sides Is Greater Than Twice The Median to HOME PAGE
Didn't find what you were looking for? Or want to know more information about Math Only Math. Use this Google Search to find what you need.

Recent Articles
-
5th Grade Factors and Multiples | Definitions | Solved Examples | Math
Mar 23, 25 02:39 PM
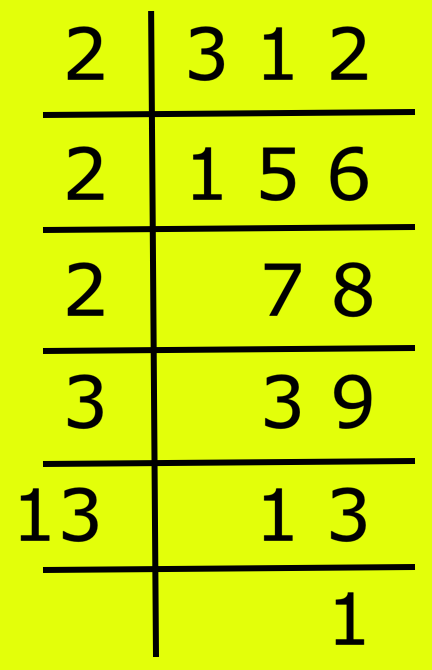 Here we will discuss how factors and multiples are related to each other in math. A factor of a number is a divisor which divides the dividend exactly. A factor of a number which is a prime number is…
 -
Adding 2-Digit Numbers | Add Two Two-Digit Numbers without Carrying
Mar 23, 25 12:43 PM
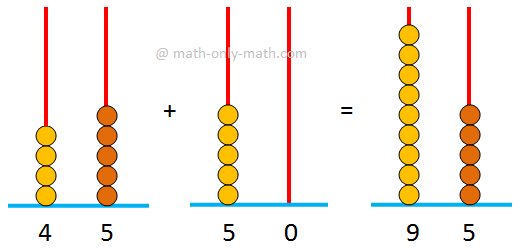 Here we will learn adding 2-digit numbers without regrouping and start working with easy numbers to get acquainted with the addition of two numbers.
 -
Worksheet on 12 Times Table | Printable Multiplication Table | Video
Mar 23, 25 10:28 AM
 Worksheet on 12 times table can be printed out. Homeschoolers can also use these multiplication table sheets to practice at home.
 -
Vertical Subtraction | Examples | Word Problems| Video |Column Method
Mar 22, 25 05:20 PM
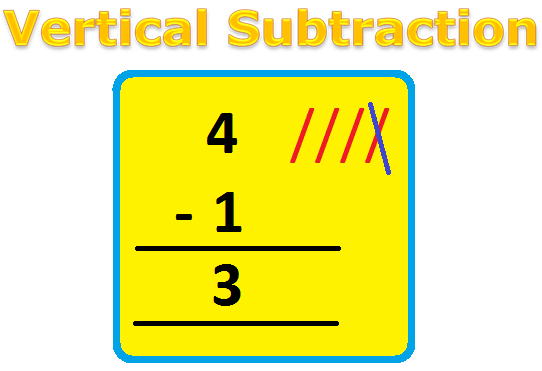 Vertical subtraction of 1-digit number are done by arranging the numbers column wise i.e., one number under the other number. How to subtract 1-digit number vertically?
 -
Worksheet on 11 Times Table | Printable Multiplication Table | Video
Mar 22, 25 05:08 PM
 Worksheet on 11 times table can be printed out. Homeschoolers can also use these multiplication table sheets to practice at home.
New! Comments
Have your say about what you just read! Leave me a comment in the box below. Ask a Question or Answer a Question.