Subscribe to our ▶️ YouTube channel 🔴 for the latest videos, updates, and tips.
Problems on Histogram
We will discuss here some of the problems on histogram.
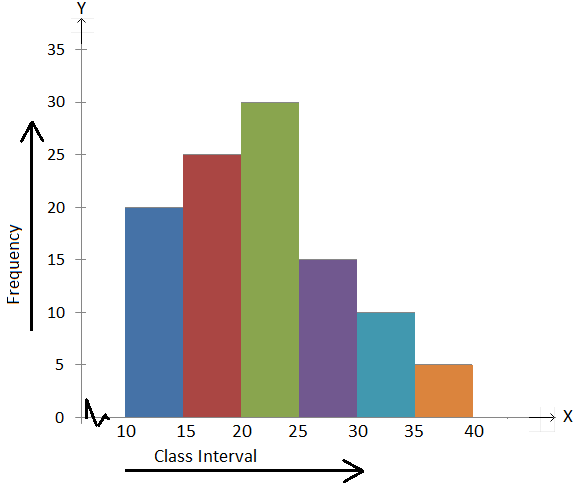
1. The histogram for a frequency distribution is given below.
Answer the following.
(i) What is the frequency of the class interval 15 – 20?
(ii) What is the class intervals having the greatest frequenciey?
(iii) What is the cumulative frequency of the class interval 25 – 30?
(iv) Construct a short frequency table of the distribution.
(v) Construct a cumulative frequency table of the distribution.
Solution:
(i) 25
(ii) 20 – 25
(iii) 90
(iv)
|
Class Interval 10 - 15 15 - 20 20 - 25 25 - 30 30 - 35 35 - 40 |
Frequency 20 25 30 15 10 5 |
(v)
|
Class Interval 10 - 15 15 - 20 20 - 25 25 - 30 30 - 35 35 - 40 |
Frequency 20 25 30 15 10 5 |
Cumulative Frequency 20 45 75 90 100 105 |
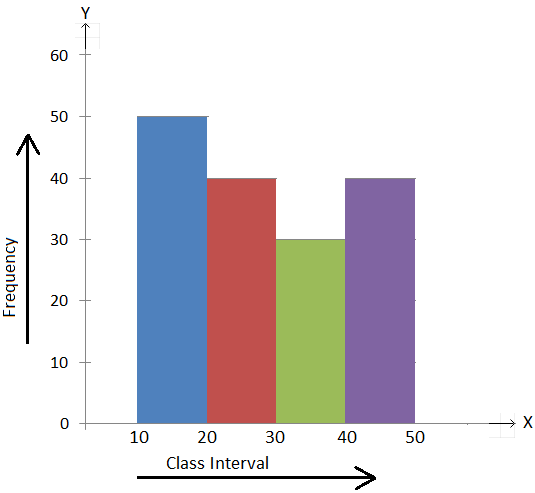
2. The histogram for a frequency distribution is as shown below.
Answer the following.
(i) Find the class intervals having the greatest and the least frequencies.
(ii) Find the class interval whose frequency is 40.
(iii) What is the frequency of the class interval 30 – 40?
(iv) What is the cumulative frequency of the class interval 30 – 40?
(v) Construct the frequency table of the distribution.
Solution:
(i) The class interval 10 – 20 has the greatest frequency as the rectangle corresponding to the interval has the greatest area, the height being the greatest.
(ii) 20 – 30
(iii) 30
(iv) 50 + 40 + 30 = 120
(v)
Class Interval
10- 20
20 - 30
30 - 40
40 - 50
Frequency
50
40
30
40
Didn't find what you were looking for? Or want to know more information about Math Only Math. Use this Google Search to find what you need.


New! Comments
Have your say about what you just read! Leave me a comment in the box below. Ask a Question or Answer a Question.