Subscribe to our ▶️ YouTube channel 🔴 for the latest videos, updates, and tips.
Pie Chart
In a pie chart, the various observations or components are represented by the sectors of a circle and the whole circle represents the sum of the values of all components.
The central angle for a component is given by:
Central angle for a component = \(\frac{\textbf{Value of the component}}{\textbf{Sum of the values of all components}}\) × 360°
How to make a pie chart or graph?
Construction of making a pie chart or graph from the given data.
Steps of pie graphs Construction:
1. Calculate the central angle for each component, given by
Central angle of component = \(\frac{\textbf{Value of the component}}{\textbf{Total value}}\) × 360°
2. Draw a circle of convenient radius.
3. Within this circle, draw a horizontal radius.
4. Starting with the horizontal radius, draw radii making central angles corresponding to the values of the respective components, till all the components are exhausted. These radii divide the whole circle into various sectors.
5. Shade each sector with different design.
This will be the required pie chart for the given data.
Pie chart examples on how to do a pie chart:
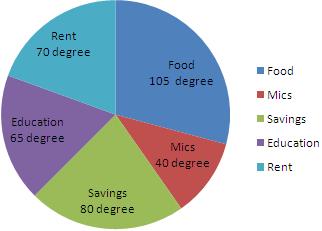
1. Mr. Bin's with a yearly salary of $ 10800 plans his budget for a year as given below:
| Item | Food | Education | Rent | Savings | Miscellaneous |
|---|---|---|---|---|---|
Represent the above data by a pie graph.
Solution:
Total amount earned by Mr. Bin in a year = $ 10800.
Central angle of component = \(\frac{\textbf{Value of the component}}{\textbf{Total value}}\) × 360°
Calculation of central angles
| Item | Amount (in $) | Central Angle |
|---|---|---|
Construction of making pie chart
Steps of construction:
1. Draw a circle of any convenient radius.
2. Draw a horizontal radius of this circle.
3. Draw sectors starting from the horizontal radious with central angles of 105 degree, 65 degree, 70 degree, 80 degree and 40 degree respectively.
4. Shade the sectors differently using different colors and label them.
Thus, we obtain the required pie chart, as shown in the given figure.
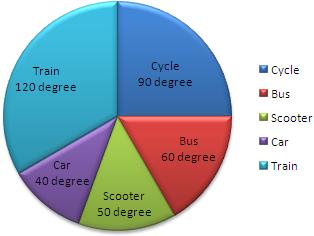
2. The data on the mode of transport used by 720 students are given below:
| Mode of Transport | Bus | Cycle | Train | Car | Scooter |
|---|---|---|---|---|---|
Represent the above data by a pie chart.
Solution:
Total number of students = 720.
Central angle for a mode of transport = \(\frac{\textbf{Number of students using that mode}}{\textbf{Total number of students}}\) × 360°
Calculation of central angles
| Mode of Transport | No. of Students | Central Angle |
|---|---|---|
Construction for creating pie chart
Steps of construction:
1. Draw a circle of any convenient radius.
2. Draw a horizontal radius of this circle.
3. Draw sectors starting from the horizontal radious with central angles of 60 degree, 90 degree, 120 degree , 40 degree and 50 degree respectively.
4. Shade the sectors differently using different colors and label them.
Thus, we obtain the required pie chart, as shown in the given figure.
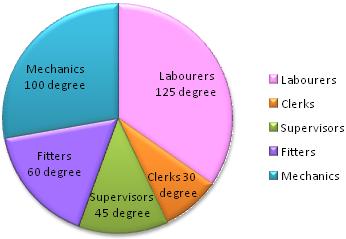
3. There are 216 workers in a factory as per list given below:
| Cadre | Labourer | Mechanic | Fitter | Supervisor | Clerk |
|---|---|---|---|---|---|
Represent the above data by a pie chart.
Solution:
Total number of workers = 216.
Central angle for a cadre = \(\frac{\textbf{Number of workers in that cadre}}{\textbf{Total number of workers}}\) × 360°
Calculation of central angles
| Cadre | No. of Workers | Central Angle |
|---|---|---|
Construction to make a pie graph
Steps of construction:
1. Draw a circle of any convenient radius.
2. Draw a horizontal radius of this circle.
3. Draw sectors starting from the horizontal radious with central angles of 125 degree, 100 degree, 60 degree, 45 degree and 30 degree respectively.
4. Shade the sectors differently using different colors and label them.
Thus, we obtain the required pie chart, as shown in the given figure.
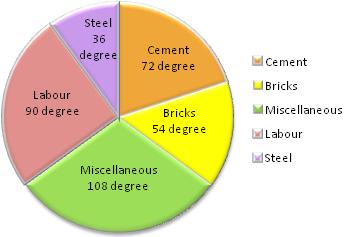
4. The following table shows the expenditure in percentage incurred on the construction of a house in a city:
| Item | Brick | Cement | Steel | Labour | Miscellaneous |
|---|---|---|---|---|---|
Represent the above data by a pie chart.
Solution:
Total percentage = 100.
Central angle for a component = \(\frac{\textbf{Value of the component}}{\textbf{100}}\) × 360°
Calculation of central angles
| Item | Expenditure (in percentage) | Central Angle |
|---|---|---|
Construction for creating pie chart
Steps of construction:
1. Draw a circle of any convenient radius.
2. Draw a horizontal radius of the circle.
3. Draw sectors starting from the horizontal radious with central angles of 54 degree, 72 degree, 36 degree, 90 degree and 108 degree respectively.
4. Shade the sectors differently using different colors and label them.
Thus, we obtain the required pie chart, shown in the adjoining figure.
● Pie Charts or Pie Graphs
● Pie Charts or Pie Graphs - Worksheets
8th Grade Math Practice
From Pie Chart to HOME PAGE
Didn't find what you were looking for? Or want to know more information about Math Only Math. Use this Google Search to find what you need.


New! Comments
Have your say about what you just read! Leave me a comment in the box below. Ask a Question or Answer a Question.