Learn math step-by-step.
Mean of the Tabulated Data
In the mean of the tabulated data, if the frequencies of n observations
x1, x2, x3, ………. xn are f1, f2, f3 ………. fn, thenMean of the tabulated data
= (f1x1 + f2x2 + f3x3 ……… fnxn)/( f1 + f2 + f3 ………. fn) = (∑ fixi)/(∑fi)
Worked-out examples on mean of the tabulated data:
1. Find the mean weight of 50 girls from the following table.
| Weight in kg | 40 | 42 | 34 | 36 | 46 |
| No. of girls | 6 | 6 | 15 | 14 | 7 |
Solution:
Mean = (f1x1 + f2x2 + f3x3 + f4x4 + f5x5)/(f1 + f2 + f3 + f4 + f5)
= (40 × 6 + 42 × 6 + 34 × 15 + 36 × 14 + 46 × 7)/(8 + 6 + 15 + 14 + 7)
= (240 + 252 + 510 + 504 + 322)/50
= 1828/50
= 36.56
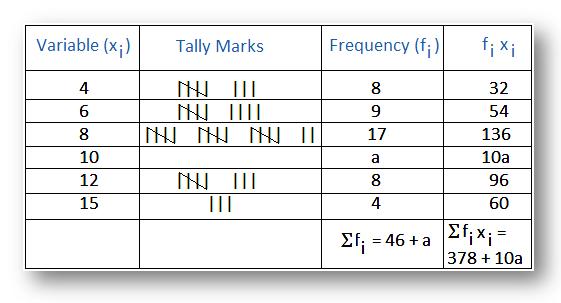
2. If the mean of the following frequency distributions is 9, find the value of `a’. Write the tally marks also.
| Variable (xi) | 4 | 6 | 8 | 10 | 12 | 15 |
| Frequency (fi) | 8 | 9 | 17 | a | 8 | 4 |
Solution:
Frequency distribution table

But given mean = 9
So, we have (378 + 10a)/(46 + a) = 9
378 + 10a = 9(46 + a)
378 + 10a = 414 + 9a
10a - 9a = 414 - 378
a = 36
● Statistics
-
Real Life Statistics
- Terms Related to Statistics
- Frequency Distribution of Ungrouped and Grouped Data
- Use of Tally Marks
- Class Limits in Exclusive and Inclusive Form
- Construction of Bar Graphs
- Mean
- Mean of the Tabulated Data
- Mode
- Median
- Construction of Pie Chart
- How to Construct a Line Graph?
From Mean of the Tabulated Data to HOME PAGE
Didn't find what you were looking for? Or want to know more information about Math Only Math. Use this Google Search to find what you need.
Recent Articles
-
Counting Numbers from 1 to 50 | Match the Number | Missing Numbers
Apr 04, 25 03:46 PM
In counting numbers from 1 to 50, recognize the numbers, count and then join the numbers in the correct number order. Here we mainly need eye-hand coordination to draw the picture and maintain the num -
Counting Eleven to Twenty with Numbers and Words |Numbers from 11 - 20
Apr 04, 25 03:21 PM
Counting eleven to twenty with numbers and words are explained below. One ten and one more is eleven. Eleven comes after ten. One ten and two more is twelve. Twelve comes after eleven. -
5th Grade BODMAS Rule Worksheet | PEMDAS | Order of operations|Answers
Apr 03, 25 03:11 PM
In 5th Grade BODMAS Rule Worksheet you will get different types of problems on mathematical expressions involving different operations, mathematical expression with 'brackets' and 'of' and simplifying… -
Worksheet on Simplification | Simplify Expressions | BODMAS Questions
Apr 03, 25 02:58 PM
In worksheet on simplification, the questions are based in order to simplify expressions involving more than one bracket by using the steps of removal of brackets. This exercise sheet -
Divisible by 2 Video |Test of Divisibility by 2 Trick| Rules| Examples
Apr 03, 25 10:25 AM
A number is divisible by 2 if the digit at unit place is either 0 or multiple of 2. So a number is divisible by 2 if digit at its units place is 0, 2, 4, 6 or 8.


New! Comments
Have your say about what you just read! Leave me a comment in the box below. Ask a Question or Answer a Question.