Grouping of Data
In mathematics grouping of data we will learn how to group data.
So far, we have considered ungrouped data. When the number of observations is large,
we may condense the data into several groups. We record the frequency of observations falling in each group.
Presentation of data in groups along with the frequency of each group is known as the frequency distribution of the grouped data.
Examples on grouping data are explained here in detailed step-by-step explanation.
Grouping of Data
1. The marks obtained by 40 students of class VIII in an examination are given below:
16, 17, 18, 3, 7, 23, 18, 13, 10, 21, 7, 1, 13, 21, 13, 15, 19, 24, 16, 2, 23, 5, 12, 18, 8, 12, 6, 8, 16, 5, 3, 5, 0, 7, 9, 12, 20, 10, 2, 23
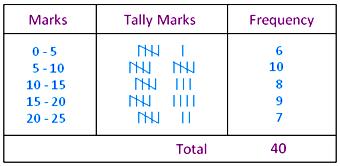
Divide the data into five groups, namely, 0-5, 5-10, 10-15, 15-20 and 20-25, where 0-5 means marks greater than or equal to 0 but less than 5 and similarly 5-10 means marks greater than or equal to 5 but less than 10, and so on. Prepare a frequency table for the grouped data.
Solution:
Arranging the given observations in ascending order, we get them as
0, 1, 2, 2, 3, 3, 5, 5, 5, 6, 7, 7, 7, 8, 8, 9, 10, 10, 12, 12, 12, 13, 13, 13, 15, 16, 16,
16, 17, 18, 18, 18, 19, 20, 21, 21, 23, 23, 23, 24
Thus, the frequency distribution may be given as under:
Note:
Here, each of the groups 0-5, 5-10, 10-15, 15-20 and 20-25 is called a class interval.
In class interval 10-15, the number 10 is called the lower limit and 15 is called the upper limit of the class interval.
The difference between the upper limit and the lower limit of any class interval is called the class size.
Thus, the class size in the above frequency distribution is 5.
The mid value of a class is called its class mark and is obtained by adding its upper and lower class limits and dividing the sum by 2.
Thus, the class mark of 0-5 is (0 + 5)/2 = 2.5
the class mark of 5-10 is (5 + 10)/2 = 7.5, etc.
2. The weights (in kg) of 35 persons are given below:
43, 51, 47, 62, 48, 40, 50, 62, 53, 56, 40, 48, 56, 53, 50, 42, 55, 52, 48, 46, 45, 54, 52, 50, 47, 44, 54, 55, 60, 63, 58, 55, 60, 58, 53
Prepare a frequency distribution table taking equal class size. One such class is 40-45 (where 45 is not included).
Solution:
We may represent the data as given below:
Note:
Here, each of the data groups 40-45, 45-50, 50-55, 55-60 and 60-65 is called a class interval.
● Data Handling
● Data Handling - Worksheet
8th Grade Math Practice
From Grouping of Data to HOME PAGE
Didn't find what you were looking for? Or want to know more information about Math Only Math. Use this Google Search to find what you need.
Recent Articles
-
Vertical Subtraction | Examples | Word Problems| Video |Column Method
Mar 22, 25 05:20 PM
Vertical subtraction of 1-digit number are done by arranging the numbers column wise i.e., one number under the other number. How to subtract 1-digit number vertically? -
Worksheet on 11 Times Table | Printable Multiplication Table | Video
Mar 22, 25 05:08 PM
Worksheet on 11 times table can be printed out. Homeschoolers can also use these multiplication table sheets to practice at home. -
Worksheet on 10 Times Table | Printable Multiplication Table | Video
Mar 21, 25 03:46 PM
Worksheet on 10 times table can be printed out. Homeschoolers can also use these multiplication table sheets to practice at home. -
5th Grade Prime and Composite Numbers | Definitions | Examples | Math
Mar 21, 25 12:18 AM
5th grade prime and composite numbers -
14 Times Table | Read and Write Multiplication Table of 14| Video
Mar 20, 25 04:03 PM
In 14 times table we will learn how to read and write multiplication table of 14. We read fourteen times table as:One time fourteen is 14 Two times fourteen are 28 Three times fourteen are 42


New! Comments
Have your say about what you just read! Leave me a comment in the box below. Ask a Question or Answer a Question.