Subscribe to our ▶️ YouTube channel 🔴 for the latest videos, updates, and tips.
Find the Quartiles for Arrayed Data
Here we will learn how to find the quartiles for arrayed data.
Step I: Arrange the grouped data in ascending order and from a frequency table.
Step II: Prepare a cumulative-frequency table of the data.
Step III: (i) For Q1: Select the cumulative frequency that is just greater than \(\frac{N}{4}\), where N is the total number of observations. The variate whose cumulative frequency is the selected cumulative frequency, is Q1.
(ii) For Q3: Select the cumulative frequency that is just greater than \(\frac{3N}{4}\), where N is the total number of observations. The variate whose cumulative frequency is the selected cumulative frequency, is Q3.
Note: In case \(\frac{N}{4}\) or \(\frac{3N}{4}\) is equal to the cumulative frequency of the variate, take the mean of the variate and the next variate.
Solved Examples on Find the Quartiles for Arrayed Data:
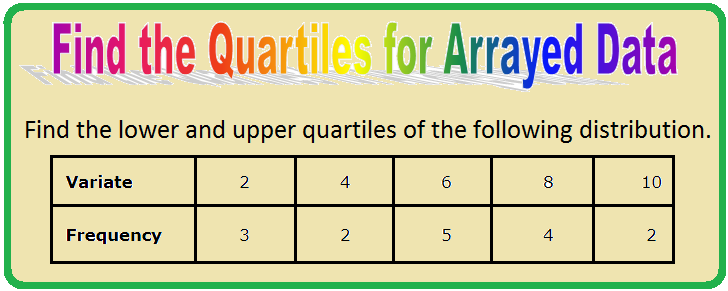
1. Find the lower and upper quartiles of the following distribution.
Variate
2
4
6
8
10
Frequency
3
2
5
4
2
Solution:
The cumulative-frequency table of the data is as below.
|
Variate 2 4 6 8 10 |
Frequency 3 2 5 4 2 N = 16 |
Cumulative Frequency 3 5 10 14 16 |
Here, \(\frac{N}{4}\) = \(\frac{16}{4}\) = 4.
The cumulative frequency just greater than 4 is 5.
The variate whose cumulative frequency is 5 is 4.
So, Q1 = 4.
Next, \(\frac{3N}{4}\) = \(\frac{3 × 16}{4}\) = \(\frac{48}{4}\) = 12.
The cumulative frequency just greater than 12 is 14.
The variate whose cumulative frequency is 14 is 8.
2. Marks obtained by 70 students in an examination are given below.
Find the upper quartile.
Marks
25
50
35
65
45
70
Number of Students
6
15
12
10
18
9
Solution:
Arrange the data in ascending order, the cumulative-frequency table is constructed as below.
Marks
25
35
45
50
65
70
Frequency
6
12
18
15
10
9
Cumulative Frequency
6
18
36
51
61
70
Here, \(\frac{N}{4}\) = \(\frac{70}{4}\) = \(\frac{35}{2}\) = 17.5.
Cumulative frequency just greater than 17.5 is 18.
The variate whose cumulative frequency is 18, is 35.
So, Q1 = 35.
Again, \(\frac{3N}{4}\) = \(\frac{3 × 70}{4}\) = \(\frac{105}{4}\) = 52.5.
Cumulative frequency just greater than 52.5 is 61.
The variate whose cumulative frequency is 61, is 65.
Therefore, Q3 = 65.
From Find the Quartiles for Arrayed Data to HOME PAGE
Didn't find what you were looking for? Or want to know more information about Math Only Math. Use this Google Search to find what you need.


New! Comments
Have your say about what you just read! Leave me a comment in the box below. Ask a Question or Answer a Question.