Converse of Midpoint Theorem
The straight line drawn through the midpoint of one side of a triangle parallel to another bisects the third side.
Given: In ∆PQR, S is the midpoint of PQ, and ST is drawn parallel to QR.

To prove: ST bisects PR, i.e., PT = TR.
Construction: Join SU where U is the midpoint of PR.

Proof:
|
Statement |
Reason |
|
1. SU ∥ QR and SU = 12QR. |
1. By Midpoint Theorem. |
|
2. ST ∥QR and SU ∥ QR. |
2. Given and statement 1. |
|
3. ST ∥ SU. |
3. Two lines parallel to the same line are parallel themselves. |
|
4. ST and SU are not the same line. |
4. From statement 3. |
|
5. T and U are coincident points. |
5. From statement 4. |
|
6. T is the midpoint of PR (Proved). |
6. From statement 5. |
From Converse of Midpoint Theorem to HOME PAGE
Didn't find what you were looking for? Or want to know more information about Math Only Math. Use this Google Search to find what you need.

Recent Articles
-
Vertical Subtraction | Examples | Word Problems| Video |Column Method
Mar 22, 25 05:20 PM
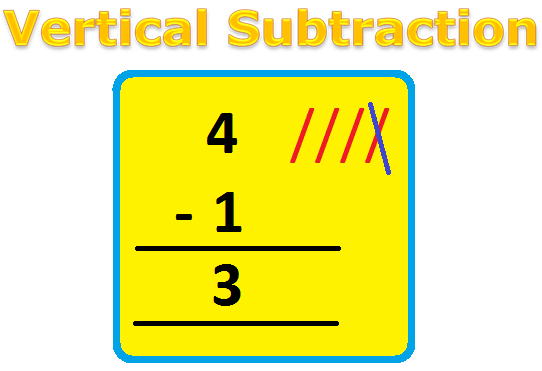 Vertical subtraction of 1-digit number are done by arranging the numbers column wise i.e., one number under the other number. How to subtract 1-digit number vertically?
 -
Worksheet on 11 Times Table | Printable Multiplication Table | Video
Mar 22, 25 05:08 PM
 Worksheet on 11 times table can be printed out. Homeschoolers can also use these multiplication table sheets to practice at home.
 -
Worksheet on 10 Times Table | Printable Multiplication Table | Video
Mar 21, 25 03:46 PM
 Worksheet on 10 times table can be printed out. Homeschoolers can also use these multiplication table sheets to practice at home.
 -
5th Grade Prime and Composite Numbers | Definitions | Examples | Math
Mar 21, 25 12:18 AM
5th grade prime and composite numbers -
14 Times Table | Read and Write Multiplication Table of 14| Video
Mar 20, 25 04:03 PM
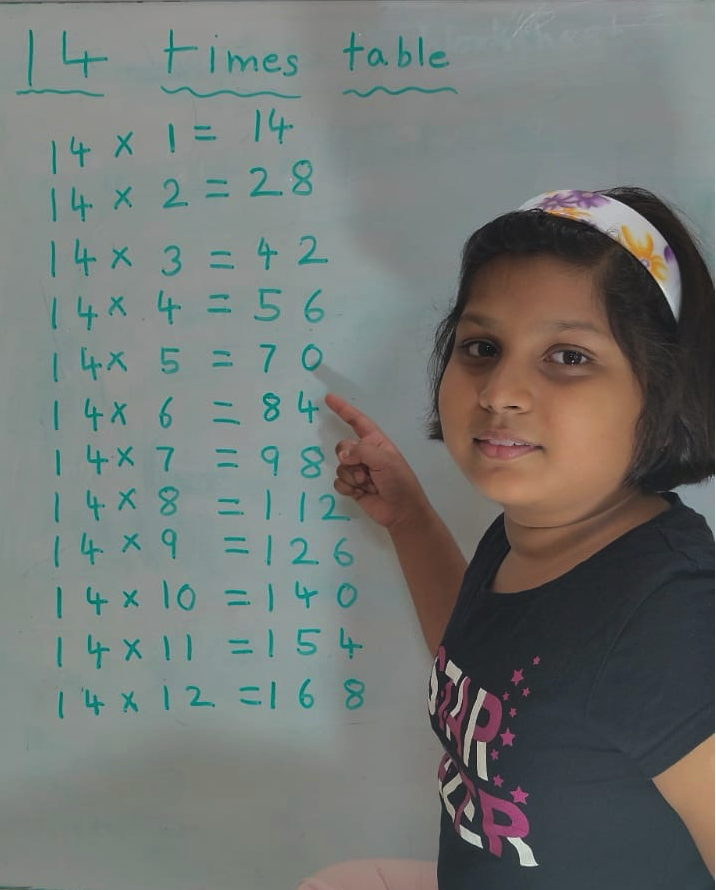 In 14 times table we will learn how to read and write multiplication table of 14. We read fourteen times table as:One time fourteen is 14 Two times fourteen are 28 Three times fourteen are 42
New! Comments
Have your say about what you just read! Leave me a comment in the box below. Ask a Question or Answer a Question.