Construct bar Graph on Graph Paper
How to construct bar graph on graph paper?
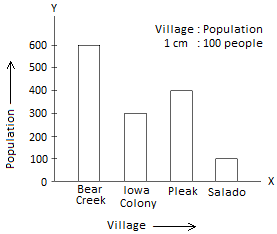
1. Draw a bar graph to represent the following data.
The population recorded in 4 villages was
|
Village |
Bear Creek |
Iowa Colony |
Pleak |
Salado |
|
Population |
600 |
300 |
400 |
100 |
In a graph paper, draw two lines OX and OY perpendicular to each other. Ox and OY are the horizontal axis and vertical axis respectively. On OY, put 6 marks at intervals of 1 cm starting from O. Label them 100, 200 and so on. The resulting population Scale will be used to read the population of different villages.
Now, on the horizontal axis (OX) make 4 marks at equal
intervals. Write the names of the villages, below them. There draw a vertical
bar (or line) which reaches up to 600 at the mark for Bear Creek. This bar
represents the population of Bear Creek. Similarly, draw vertical bars which reach
up to 300, 400 and 100 for the other village. Write ‘Village →’ and ‘Population
→’ next to OX and OY, write the little of the graph. You may also mention the
scale of the graph.
The same bar graph can be drawn using horizontal bars or lines. In this, the population scale is shown on the horizontal axis (OX), as shown below.
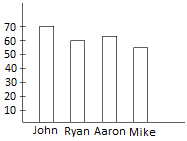
2. The weight of four people are recorded by a bar grapg given below. Find their weights. Who is the heaviest and who is the lightest?
In this graph, the scale is 1 mm (small division); 1 kg. As the bar corresponding to Mike extends up to 55, his weight is 55 kg. In this way, the weight of the Aaron is 62 kg, that of Ryan 60 kg and that of John is 69 kg.
Mike is the lightest while John is the heaviest.
5th Grade Math Problems
From Construct bar Graph on Graph Paper to HOME PAGE
Didn't find what you were looking for? Or want to know more information about Math Only Math. Use this Google Search to find what you need.
Recent Articles
-
Worksheet on 10 Times Table | Printable Multiplication Table | Video
Mar 21, 25 03:46 PM
Worksheet on 10 times table can be printed out. Homeschoolers can also use these multiplication table sheets to practice at home. -
5th Grade Prime and Composite Numbers | Definitions | Examples | Math
Mar 21, 25 12:18 AM
5th grade prime and composite numbers -
14 Times Table | Read and Write Multiplication Table of 14| Video
Mar 20, 25 04:03 PM
In 14 times table we will learn how to read and write multiplication table of 14. We read fourteen times table as:One time fourteen is 14 Two times fourteen are 28 Three times fourteen are 42 -
5th Grade Test of Divisibility Rules | Divisibility Rules From 2 to 12
Mar 20, 25 04:00 PM
In 5th grade test of divisibility rules we will learn about the exact divisibility of a number by the numbers from 2 to 12. The digit in the ones place should be 2, 4, 6, 8 or 0. -
5th Grade Even and Odd Numbers | Definitions | Examples
Mar 20, 25 02:45 AM
Numbers which are exactly divisible by 2 are even numbers. For example. 2,4,6,8,20,48,88, etc. are even numbers. They are multiples of 2. Numbers which are not exactly divisible by 2 are odd numbers…


New! Comments
Have your say about what you just read! Leave me a comment in the box below. Ask a Question or Answer a Question.