Worksheet on Mental Math Subtraction
Practice the tricky questions given in the worksheet on mental math subtraction. Try to subtract by using the trick and skills so that the benefits can be enjoyed by both kids and adults. Anyone can learn mental math skills and tricks which can be easily learned by performing mentally on a regular basis.
1. Subtract the following numbers mentally by using addition method:
(i) 93 – 67
(ii) 84 – 31
(iii) 52 – 14
(iv) 95 – 48
(v) 98 – 52
(vi) 63 – 26
2. Subtract the
following numbers mentally by counting backward method:
(i) 19 – 4
(ii) 18 – 7
(iii) 17 – 6
(iv) 20 – 3
(v) 53 – 5
(vi) 43 – 8
3. Find the difference of the following numbers using the tricky and skilled method:
(i) 74 – 47
(ii) 57 – 28
(iii) 57 – 25
(iv) 73 – 27 = 73 – (20 + 7) = (73 – 20) – 7 = 53 – 7 = ?
(v) 68 – 36 = 68 – (?) = ?
(vi) 91 – 62 = 91 – (60 + 2) = ?
(vii) 87 – 54
(viii) 67 – 28 = 67 – 30 + 2 = 37 + 2 = ?
(ix) 164 – 41 = (164 – 1) – 40 = ?
(x) 57 – 29
(xi) 81 – 15
4. To find the difference between two numbers, we always subtract the __________ number from the __________ number.
5. 6,542 - 2,260 = 4,282; Here, minuend and subtrahend are __________ and __________ respectively.
6. 9,640 - 9,640 = __________
7. What number should be subtracted from the smallest 4-digit number to get the largest 3-digit number?
8. Find the difference of the place values of 4s in 4,4029.
9. 4,892 - 1,000 = __________
10. The difference between the smallest 3-digit number and the largest 2-digit number is __________
11. 6,298 -3,000 = __________
12. 2,500 - 500 + 3,000 = __________
13. What should be subtracted from 5 thousands to get 6 hundreds?
14. What are the two numbers which give 100 if added and also give 100 when subtracted?
Answers for the worksheet on mental math subtraction are given below to check whether you get the exact answers when you use the tricky strategies to subtract mentally.
Answers:
1. (i) 26
(ii) 53
(iii) 38
(iv) 47
(v) 46
(vi) 37
2. (i) 15
(ii) 11
(iii) 11
(iv) 17
(v) 48
(vi) 35
3. (i) 27
(ii) 29
(iii) 32
(iv) 46
(v) 32
(vi) 29
(vii) 33
(viii) 39
(ix) 123
(x) 28
(xi) 66
4. smaller; greater
5. 6,542; 2,260
6. 0
7. 1
8. 36,000
9. 3,892
10. 1
11. 3,298
12. 5,000
13. 4,400
14. 0 and 100
You might like these
Mental Math Addition | Math Tricks for Addition |Calculate Mental Math
What are the strategies to calculate mental math addition? The tricky strategies help us to calculate addition mentally. Learn how to use mental math tricks or techniques that required mental add
Worksheet on Subtraction of 4-Digit Numbers|Subtracting 4-Digit Number
Practice the questions given in the worksheet on subtraction of 4-digit numbers. Here we will subtract two 4-digit numbers (without borrowing and with borrowing) to find the difference between them.
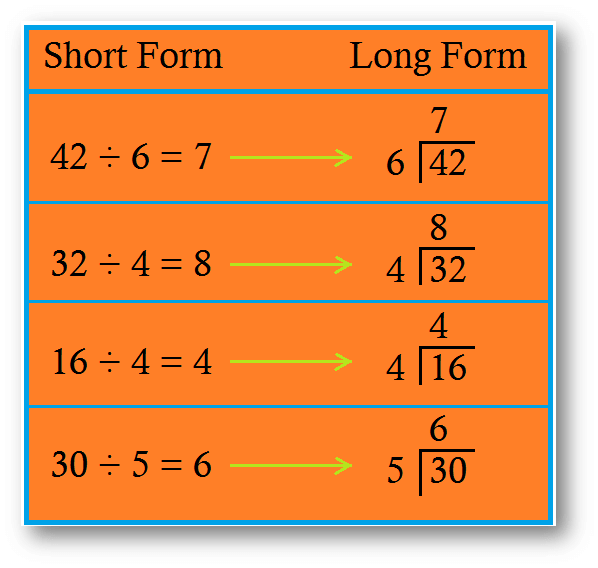
Long Division | Method | Steps | Examples | Long Division Worksheets
As we know that the division is to distribute a given value or quantity into groups having equal values. In long division, values at the individual place (Thousands, Hundreds, Tens, Ones) are dividend one at a time starting with the highest place.
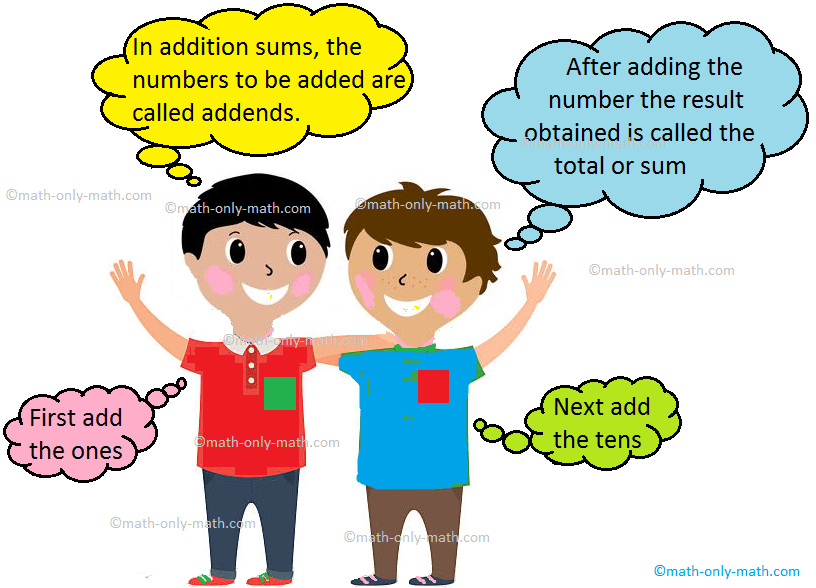
Facts about Addition|Addition of Small Numbers|Add 4 & 5-digit Numbers
The operation to find the total of different values is called addition. Let us know some facts about addition which will help us to learn to add 4-digit and 5-digit numbers. 1. Addition of small numbers can be done horizontally. Example: 6 + 2 + 3 = 11
Facts about Subtraction | Subtraction of Small Numbers|Solved Examples
The operation to finding the difference between two numbers is called subtraction. Let us know some facts about subtraction which will help us to learn subtraction of large numbers. 1. Subtraction with small numbers can be worked out horizontally. Example: 8 – 5 = 3 24 – 4 =
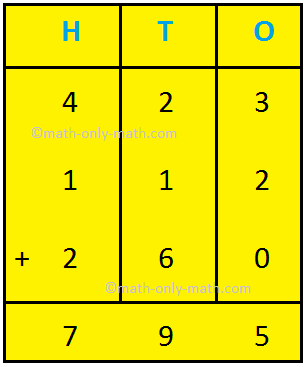
Addition of Three 3-Digit Numbers | With and With out Regrouping |Math
Without regrouping: Adding three 3-digit numbers is same as adding two 3-digit numbers.
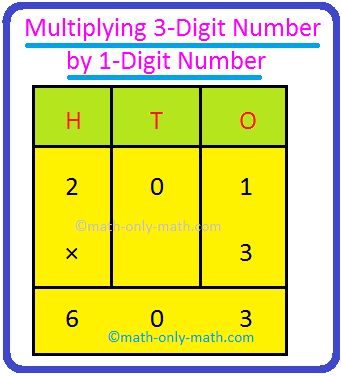
Multiplying 3-Digit Number by 1-Digit Number | Three-Digit Multiplicat
Here we will learn multiplying 3-digit number by 1-digit number. In two different ways we will learn to multiply a two-digit number by a one-digit number. 1. Multiply 201 by 3 Step I: Arrange the numbers vertically. Step II: Multiply the digit at the ones place by 3.
Relationship between Multiplication and Division |Inverse Relationship
We know that multiplication is repeated addition and division is repeated subtraction. This means that multiplication and division are inverse operation. Let us understand this with the following example.
Reading 4-Digit Numbers | Number names | Numerals | Worksheet | Answer
In 3rd grade it's very important for reading 4-digit numbers. To read a four digit number, first read thousands, then hundreds and lastly the number formed by tens and ones. Some of the following examples are: 1. Read 3 2 6 4 and write it in words. 2. Read 4 0 3 6 and
Successor and Predecessor of 4-Digit Number | Basic Concept |Worksheet
We will learn the successor and predecessor of four digit number. The number that comes just after a given number is called the successor of the given number. For example 1028 comes just after 1027. So 1028 is the successor of 1027.

From Worksheet on Mental Math Subtraction to HOME PAGE
Didn't find what you were looking for? Or want to know more information about Math Only Math. Use this Google Search to find what you need.


Recent Articles
-
Worksheet on Bar Graphs | Bar Graphs or Column Graphs | Graphing Bar
May 11, 24 06:14 PM
 In math worksheet on bar graphs students can practice the questions on how to make and read bar graphs or column graphs. Test your knowledge by practicing this graphing worksheet where we will
 -
Bar Graph | Bar Chart | Interpret Bar Graphs | Represent the Data
May 11, 24 06:04 PM
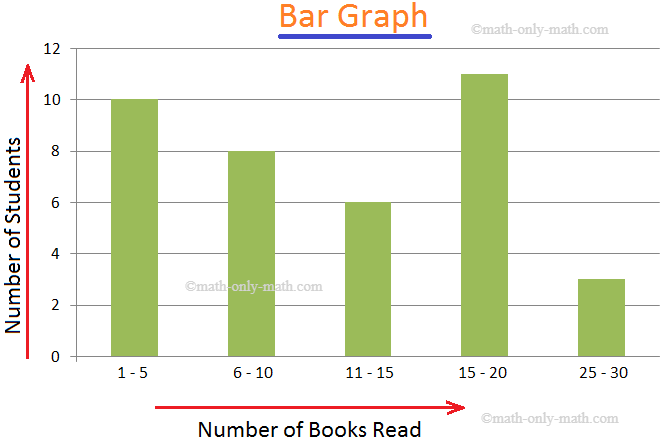 We learn how to represent the data on the bar graph. Data can be represented by bars (like rectangle) whose lengths represent numerical values. One can use horizontal or vertical bars. Instead of rect…
 -
Worksheet on Pie Chart | Questions on Pie Graphs | Creating Pie Chart
May 11, 24 04:44 PM
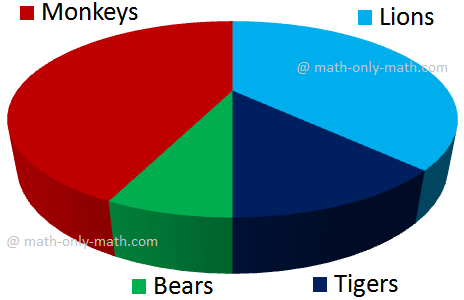 In math worksheet on pie chart students can practice different types of questions on pie graphs. From the given data we need to calculate the central angle of the components to construct the questions
 -
Worksheet on Pictographs | Picture Graph Worksheets | Pictograph Works
May 10, 24 05:10 PM
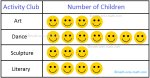 In worksheet on pictographs, all grade students can practice the questions on data handling. We can present the given information in many ways. In pictograph the information is presented by using a pi…
 -
Construction of Pie Chart | Steps of Construction | Solved Examples
May 09, 24 03:25 PM
 The pie chart is a pictorial representation of data relative to a whole. Each portion in the circle represent an element of the collected data. The pie chart represents the composition of various elem…
New! Comments
Have your say about what you just read! Leave me a comment in the box below. Ask a Question or Answer a Question.