Worksheet on Pie Chart
In math worksheet on pie chart students can practice different types of questions on pie graphs. From the given data we need to calculate the central angle of the components to construct the questions given in worksheet on pie chart.
A. Questions on Creating Pie Chart:
1. Mr. X monthly income is $ 14400. The monthly expenses of his family on various items are given below.
| Item | Rent | Food | Clothing | Education | Savings |
|---|---|---|---|---|---|
Represent the above data by a pie chart.
2. In a Zoological park there are 1000 creatures as per the following table given below:
| Beast Animals | Other Land Animals | Birds | Water Animals | Reptiles |
|---|---|---|---|---|
Represent the above data by a pie chart.
3. Various modes of transport used by 1260 students in a given school are given below:
| School Bus | Private Bus | Bicycle | Rickshaw | On foot |
|---|---|---|---|---|
Represent the above data by a pie chart.
4. The data given below shows number of hours spent by a school boy on different activities on a working day.
| Activity | School | Homework | Play | Sleep | Others | Total |
|---|---|---|---|---|---|---|
Represent the above data by a pie graph.
5. In a company there are 1080 workers of different religions. The data of the different religion are given below:
| Religion | Hindu | Sikh | Islam | Christian |
|---|---|---|---|---|
Draw a pie chart to represent the above data.
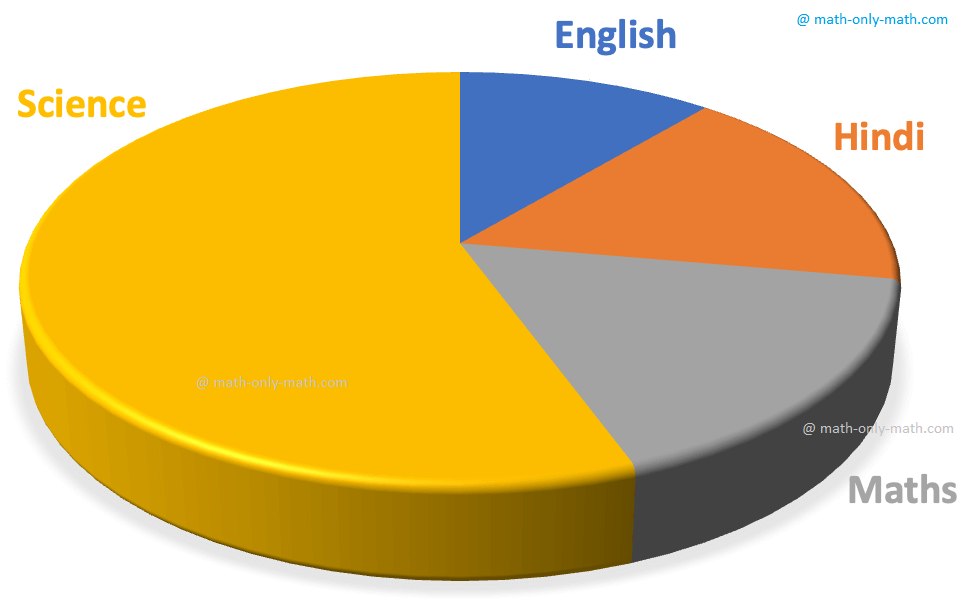
6. The marks obtained by Sam in an examination are given below:
| Subject | English | French | Mathematics | Science | Social Science |
|---|---|---|---|---|---|
Represent the above data by a pie chart.
Hint: Total marks obtained = (105 + 75 +150 +120 + 90) = 540.
7. The following table gives the number of different fruits kept in a hamper.
| Type of Fruit | Mangoes | Apples | Oranges | Coconuts | Pomegranates |
|---|---|---|---|---|---|
Represent the above data by a pie chart.
Hint: Total number of fruits = 90
Worksheet on Pie Chart
8. The following data shows the agricultural production in India during a certain year.
| Foodgrain | Rice | Wheat | Coarse Cereals | Pulses |
|---|---|---|---|---|
Draw a pie chart to represent the above data.
Hint: Total production (57 + 76 + 38 + 19) million tonnes = 190 million tonnes.
9. Given below is the result of an annual examination of a class, showing the percentage of students in each category.
| First Division | Second Division | Third Division | Failed |
|---|---|---|---|
Represent the above data by a pie chart.
10. The following table shows the percentage of buyers of four different brands of bathing soaps.
| Brand | A | B | C | D |
|---|---|---|---|---|
Represent the above data by a pie chart.
B. Tick (✔) the correct answer in each of the following:
1. Mr. Bond's monthly income is $ 2400 and his monthly expenditure on rent is $ 250. The central angle of the sector representing rent expenses in the pie chart would be …………… .
(a) 30°
(b) 37 ¹/₂°
(c) 45°
(d) 60°
2. If 35% of the people residing in a locality are Sikhs then the central angle of the sector representing the Sikh community in the pie chart would be
(a) 108°
(b) 115°
(c) 126°
(d) 135°
3. If in the pie chart representing the number of students opting for different streams of study out of a total strength of 1650 students, the central angle of the sector representing Arts students is 48°, what is the number of students who opted for Arts stream?
(a) 220
(b) 240
(c) 275
(d) 320
4. In the pie chart representing the percentages of students having interest in reading various kinds of books, the central angle of the sector representing students reading novels is 81° What is the percentage of students interested in reading novels?
(a) 15 %
(b) 18 %
(c) 22\(\frac{1}{2}\) %
(d) 27\(\frac{1}{2}\) %
C. Different types of Problems on Pie Graph:
1. George make a circle chart of the favourite animal of children visiting the zoo. Look at the circle chart and write True (T) or False (F):

(i) More children like monkeys than lions.
(ii) The least favourite animal is bear.
(iii) More children like tigers than bears.
(iv) The second most loved animal is the lion.
(v) The third most loved animal is the bear.
2. Look at the circle chart showing the sale of different kinds of cars in the month of July. If the circle represents 100 cars, give the number

(i) The number of Maruti cars __________
(ii) The number of Hyundai cars __________
(iii) The number of Ford Escort cars __________
Answers for the worksheet on pie chart are given below to check the exact answer.
Answers:
B. 1. (b)
2. (c)
3. (a)
4. (c)
C. 1. (i) True
(ii) True
(iii) True
(iv) True
(v) False
2. (i) 50
(ii) 25
(iii) 25
You might like these
Worksheet on Pictographs | Picture Graph Worksheets | Pictograph Works
In worksheet on pictographs, all grade students can practice the questions on data handling. We can present the given information in many ways. In pictograph the information is presented by using a picture as symbol. A pictograph has a title and a key.
Pictograph to Represent The Collected Data | Forming Pictograph | Math
Pictures or symbols are made in a pictograph to represent the collected data. So, we can say that a pictograph represents the data and gives information quickly and clearly.
Interpreting a Pictograph | Information Regarding the Pictograph |Math
In interpreting a pictograph, we get a lot of information regarding the pictograph items. The following examples may illustrate the interpretation of pictographs.
Worksheet on Bar Graphs | Bar Graphs or Column Graphs | Graphing Bar
In math worksheet on bar graphs students can practice the questions on how to make and read bar graphs or column graphs. Test your knowledge by practicing this graphing worksheet where we will
Construction of Pie Chart | Steps of Construction | Solved Examples
The pie chart is a pictorial representation of data relative to a whole. Each portion in the circle represent an element of the collected data. The pie chart represents the composition of various elements in a whole. The total value of the pie chart is always 100%.
Examples of Pictographs |Pictorial Representation|Pictograph Questions
Some sample examples of pictographs or pictorial representation are shown, how the objects are used to give information regarding mathematical data. Read the pictograph and gather the information
Bar Graph | Bar Chart | Interpret Bar Graphs | Represent the Data
We learn how to represent the data on the bar graph. Data can be represented by bars (like rectangle) whose lengths represent numerical values. One can use horizontal or vertical bars. Instead of rectangles one way even use line segments in such graphs.


● Pie Charts or Pie Graphs
● Pie Charts or Pie Graphs - Worksheets
From Worksheet on Pie Chart to HOME PAGE
Didn't find what you were looking for? Or want to know more information about Math Only Math. Use this Google Search to find what you need.


Recent Articles
-
Worksheet on Formation of Numbers | Questions on Formation of Numbers
May 20, 24 04:49 AM
In worksheet on formation of numbers, four grade students can practice the questions on formation of numbers without the repetition of the given digits. This sheet can be practiced by students -
Worksheet on Forming Numbers with Digits | Smallest & Greatest Numbers
May 20, 24 02:06 AM
 In the worksheet on forming numbers with digits, the questions will help us to practice how to form different types of smallest and greatest numbers using different digits. We know that all the number…
 -
Shifting of Digits in a Number |Exchanging the Digits to Another Place
May 19, 24 06:35 PM
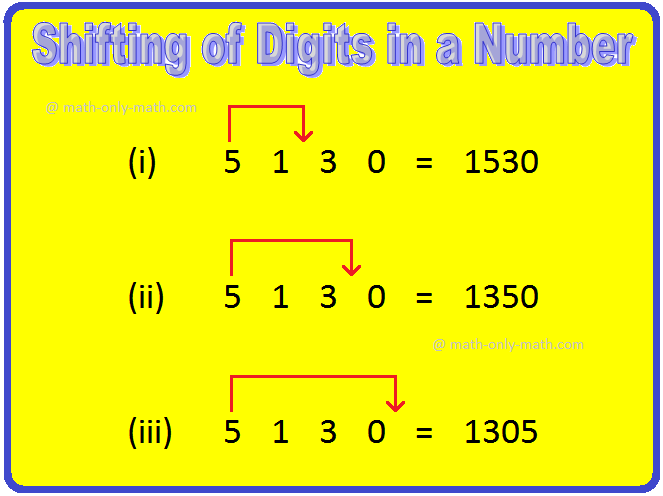 What is the Effect of shifting of digits in a number? Let us observe two numbers 1528 and 5182. We see that the digits are the same, but places are different in these two numbers. Thus, if the digits…
 -
Formation of Greatest and Smallest Numbers | Arranging the Numbers
May 19, 24 03:36 PM
 the greatest number is formed by arranging the given digits in descending order and the smallest number by arranging them in ascending order. The position of the digit at the extreme left of a number…
 -
Formation of Numbers with the Given Digits |Making Numbers with Digits
May 19, 24 03:19 PM
In formation of numbers with the given digits we may say that a number is an arranged group of digits. Numbers may be formed with or without the repetition of digits.
New! Comments
Have your say about what you just read! Leave me a comment in the box below. Ask a Question or Answer a Question.