Area
The amount of surface that a plane figure covers is called its area. It’s unit is square centimeters or square meters etc.
We
can find the area of the surface enclosed, by finding the number of complete
unit squares inside the figure drawn on a square sheet. The unit of area is
square centimeter.
A rectangle, a square, a triangle and a circle are all examples of closed plane figures.
In the following figures, the shaded region of each of the object is the surface occupied by it. We call it area.
Interior and Exterior of a Region
The part of the plane enclosed by a closed figure is called the interior region and the part of the plane outside the enclosed figure is called the exterior region.

In the adjacent figure a rectangle ABCD is shown. It’s interior and exterior regions are also shown here.
Area is always measured in squares and the unit of area square units (sq. cm., sq. m. or cm2, m2).
Let us draw some plane shape on a square sheet as shown below.

Here, we can see that the shape at figure (i) is the smallest in size or we can say that it encloses least space or surface than figure (ii) and figure (iii). Let us compare the surface of paper enclosed by each shapes. The shape at figure (i) encloses only one unit square on the graph sheet. The shape at figure (ii) encloses 4 unit squares and the shape at figure (iii) encloses 9 unit squares on the graph sheet. We observe that larger shapes encloses more surface than the smallest shapes. The surface enclosed by a plane shape is called its area.
Observe the following figures

Which triangle is the biggest and which triangle is the smallest in size?
Clearly, the first In triangle is the smallest and the third triangle is the biggest in size.
How do we know that the triangle is the smallest and the third triangle is the biggest?
In fact, we just compared the surface of paper enclosed by each figure.
Again observe the figures:

Which rectangle is the larger in size?
Clearly, the first rectangle is larger in size because it enclosed more surface than the other.
Again, observe the figures:

Here also, the enclosed shaded surface of the first square is less than the shaded region of the second one. Hence the first figure is smaller in size.
From these examples, it is clear that when we talk about the size of a plane figure, we consider the surface enclosed by it.
The measure of the surface enclosed by a plane figure is called its area.
Measuring Regions:
We know that a flat surface is called a plane. A square, a triangle and a circle are some examples of plane shapes. The amount of surface enclosed is called its area. We can calculate the area of a plane shape drawn on a square sheet by counting the unit squares enclosed by it.
For irregular shapes, we count 2 half squares as one and ignore those squares whose less than half part is enclosed by the figure.
Unit of Area:
Observe the figures:

Can you tell which figure has the greater area? Here it is difficult to say which figure has the greater of smaller area by mere observation. To decide which figure has the greater area, perform the following activity.
Cover both the figures with the pieces of erasers.

We can see that 8 pieces of the erasers cover the first figure completely, and 9 pieces of the erasers coves the second figure completely. We say that the area of the first figure is equal to the area of 8 erasers and area of the second figure is equal to the area of 9 erasers. Thus, the second figure has the greater area.
Here the top face (or bottom) of the eraser has been taken as the unit for measuring the area of each figure.
In the above activity if we use bigger erasers, will we get the same answer?
No In this case the answer will be different. So to get the same answer every time, we need a standard unit for measuring the area.
To measure weight (mass), we use g or kg as the standard units.
To measure capacity, we use mℓ or ℓ as the standard units.
To measure length, we use mm, cm or m as the standard units.
Similarly, to measure area of a square mm, cm or m is taken as the standard unit.
The area of a square of side 1 mm is expressed as 1 square mm or sq mm.
The area of a square of side 1 cm is expressed as 1 square cm or 1 sq cm.
The area of a square of side 1 m is expressed as 1 square m or 1 sq m.

Bigger areas are measured in square kilometers (sq km).
1 sq km is the area of the square whose side is 1 km.
The area is measured in square units. A square of side 1 cm or 1 m is used as standard units. Smaller unit of area is square cm or sq. cm. Bigger areas are measured in meters and kilometers.
We measure a given region by a unit region and find how many such unit regions are contained in the given region.

The measure of a region is called its area.
The area is always expressed in square units. The standard units that are generally used for measuring area are square centimeter and square meter.
The area of a square with side 1 cm each is 1 cm × 1 cm = 1 square centimeter. In short, it is expressed as cm2 or sq. cm.
The area of a square with side 1 m each is 1 m × 1 m = 1 square meter. In short, it is expressed as m2 or sq. m.
 |
 |
Area is a measure of any area surface, e.g., the surface of a table, the surface of your pencil box etc.
Area is two dimensional.
It means, to find the area of any surface we need to know two sides.
Note: Here we’ll discuss only areas of square and rectangles. Given below is a table of units of sides and corresponding units for areas.

Conversion Table:
1 m. = 100 cm.
1 sq. m. = 10000 sq. cm.
1 cm. = 10 mm.
1 sq. cm. = 100 sq. mm.
1 km = 1000 m
For finding the area of a given figure, make sure that the sides (length or breadth) are in the same unit of length. If they are given in different units, change them to the same unit.
The measure of space in a region is called its area.
The area of a square of side 1 cm is 1 square centimetre (sq.cm) or 1 centimetre2 (cm2).

Observe the following squares.
(i) In the below figure the dotted line divides the square of side 2 cm into 4 squares of equal area.

Side of each small square = 1 cm
Area of each small square = 1 cm2
Total area of the square = 4 × 1 cm2 = 4 cm2
But we know that 2 cm × 2 cm = 4 cm2
(ii) In given figure the dotted line divides the square of side 3 cm into 9 squares of equal area.

Side of each small square = 1 cm
Area of each small square = 1 cm2
Total area of the square = 9 × 1 cm2 = 9 cm2
But we know that 3 cm × 3 cm = 9 cm2
Area of a square = side × side
For Example:
1. Find the area of a square of side 8 cm.
Side = 8 cm
Area of the square = side × side
= 8 cm × 8 cm
= 64 cm2 or 64 sq.cm
● Given below is a rectangle of length 7 cm and breadth 3 cm.
It is divided into squares of area 1 cm2.

Count the number of squares. There are 21 squares.
The total area of the rectangle = Area of 21 squares
= 21 cm2
But we know that 7 cm × 3 cm = 21 cm2
Area of a rectangle = length × breadth
For Example:
1. Find the area of a rectangle whose length and breadth are 9 cm and 3 cm respectively.
Length = 9 cm
Breadth = 3 cm
Area of the rectangle = length × breadth
= 9 cm × 3 cm = 27 cm2
Solved Examples on Measuring Regions:
1. Find the area of the figures given on a graph sheet of 1 cm × 1 cm squares.


Solution:
Figure (i):
\(\frac{1}{2}\) squares = 6; Full Squares = 6
Area = \(\frac{1}{2}\) × 6 + 6 = 9 sq. cm.
Figure (ii):
Number of Squares = 12
Area = 12 sq. cm.
2. Find the area of following figures on the graph sheet of 1 cm square.

|
There are 4 squares in figure (i). So, the area of figure (i) is 4 sq. cm |
There are 8 squares in figure (ii). So, the area of figure (ii) is 8 sq. cm |
3. In the following figure, the area of each smaller square is 1 sq cm.
How many squares are there in all?

|
(ii) Here, the area of each smaller square is 1 sq mm. There are 25 such squares. So, the area of the square PQRS is 25 sq mm. |

|
(iii) Here, the area of each smaller square is 1 sq cm. There are 9 such squares. So, the are of the square EFGH is 9 sq cm. |

Now, answer the following questions to have a quick review of what we have learnt so far.
1. For the given figures find the area of each figure if each side of a square is 1 unit.

Answer:
(i) 32 sq. units
(ii) 26 sq. units
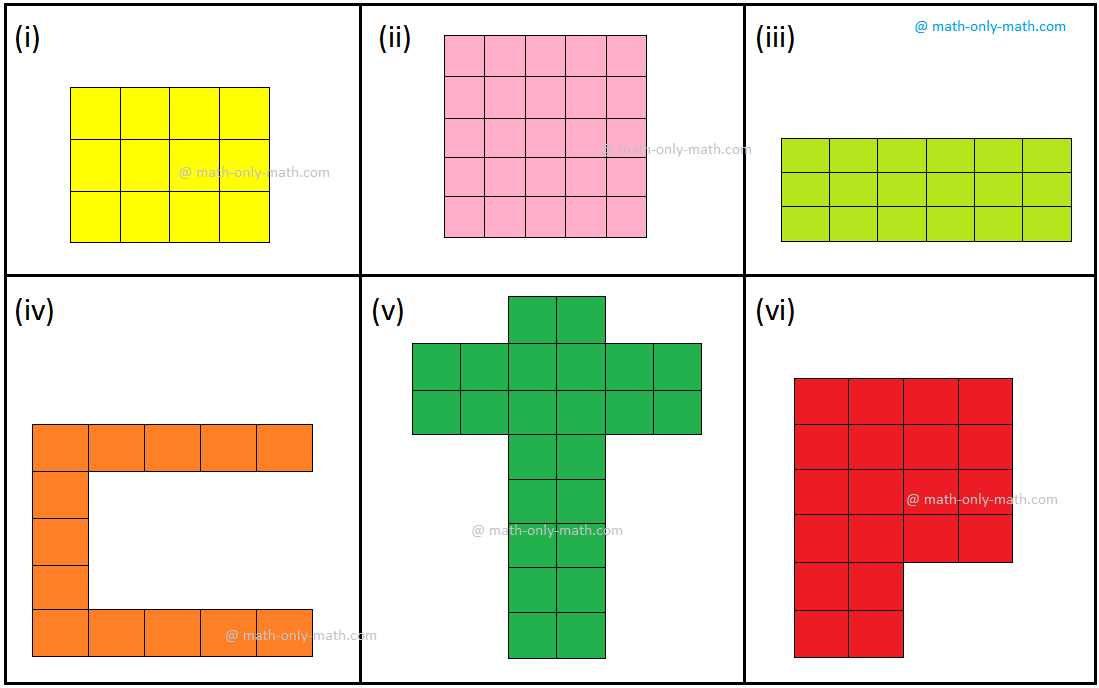
2. If area of each square is 1 square cm find the area of the given figures.
(i) Area =

(ii) Area =

(iii) Area =

(iv) Area =

Answer:
(i) 40 sq. cm
(ii) 36 sq. cm
(iii) 22 sq. cm
(iv) 20 sq. cm
3. Draw any three polygons of the largest possible size in the given grids and calculate their area if each side of a square is 1 cm.

4. Draw any shapes in the grids with the following area if each side of a square is 1 unit.
(i) Area = 9 square units

(ii) Area = 20 square units

(iii) Area = 15 square units

5. Fill in the blanks:
(i) …………………….. measures the surface covered by a 2D shape.
(ii) The area of a rectangle with length 5 m and breadth 10 m will be ……………………..
Answer:
(i) Area
(ii) 50 sq. units
6. Find the area of the following squares having sides.
(i) 10 cm
(ii) 9 cm
(iii) 3 cm
(iv) 7 cm
(v) 6 cm
Answer:
6. (i) 100 cm2
(ii) 81 cm2
(iii) 9 cm2
(iv) 49 cm2
(v) 36 cm2
7. Find the area of each of the following rectangles having:
(i) Length = 6 cm Breadth = 4 cm
(ii) Length = 5 cm Breadth = 2 cm
(iii) Length = 10 cm Breadth = 6 cm
(iv) Length = 7 cm Breadth = 4 cm
Answer:
7. (i) 24 cm2
(ii) 10 cm2
(iii) 60 cm2
(iv) 28 cm2
You might like these
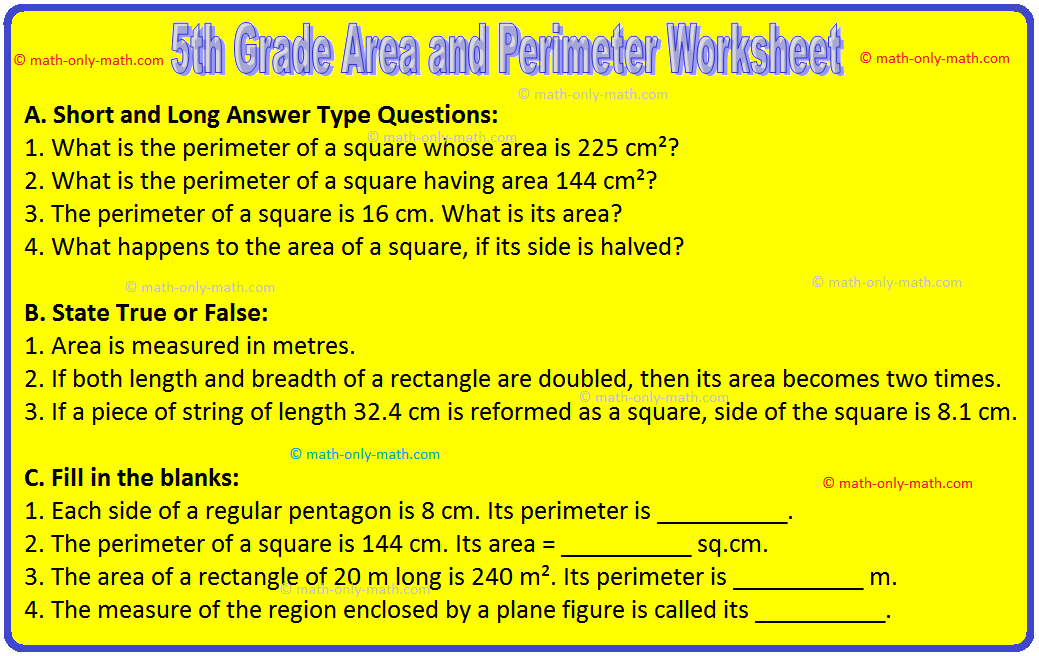
5th Grade Area and Perimeter Worksheet | With Answers | Free Worksheet
In 5th Grade Area and Perimeter Worksheet you will get different types of questions on perimeter of a triangle, perimeter of a square, perimeter of a rectangle, shapes of different kinds with the same perimeter, word problems on perimeter of a rectangle, word problems on
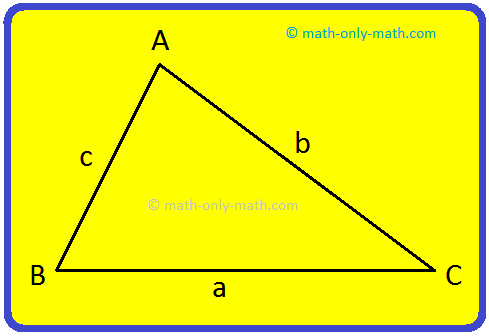
Perimeter and Area of Plane Figures | Definition of Perimeter and Area
A plane figure is made of line segments or arcs of curves in a plane. It is a closed figure if the figure begins and ends at the same point. We are familiar with plane figures like squares, rectangles, triangles and circles. Definition of Perimeter: The perimeter (P) of a
Worksheet on Perimeter | Perimeter of Squares and Rectangle | Answers
Practice the questions given in the worksheet on perimeter. The questions are based on finding the perimeter of the triangle, perimeter of the square, perimeter of rectangle and word problems. I. Find the perimeter of the triangles having the following sides.
Worksheet on Area and Perimeter of Rectangles | Word Problems |Answers
Recall the topic and practice the math worksheet on area and perimeter of rectangles. Students can practice the questions on area of rectangles and perimeter of rectangles. 1. Find the area and perimeter of the following rectangles whose dimensions are: (a) length = 17 m
Areas of Irregular Figures | Area of Irregular Shapes | Free Worksheet
Areas of irregular figures can be determined by dividing the figure into squares and rectangles. Some irregular figures are made of rectangular or square regions. The areas of such irregular figures can be determined by calculating the areas of these rectangles and squares.
Worksheet on Area | Test on Area | Home work on Area | Quiz on Area
In worksheet on area we will solve different types of question in area. 1. Find the area of a rectangle of length 24 cm and breadth 13 cm. 2. Find the area of a square of side 40 cm. 3. Find the area of a square of side 21 m.
Word Problems on Area and Perimeter | Free Worksheet with Answers
We will solve different types of word problems on area and perimeter. 1. The perimeter of a rectangular field is 260 m. If its length is 90 m, find its breadth.
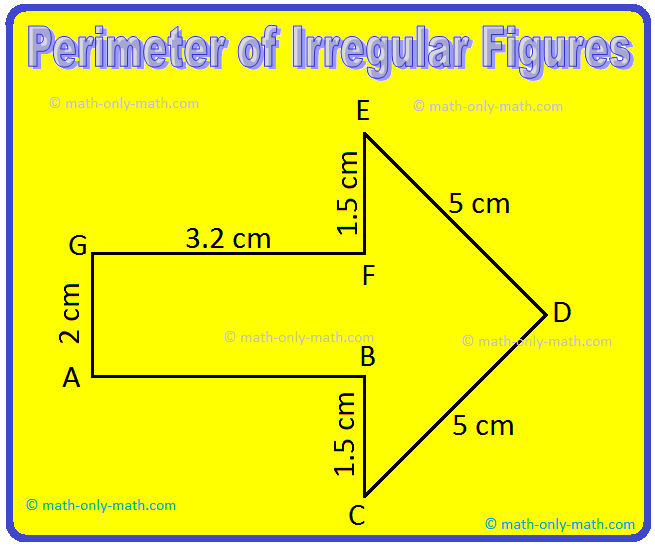
Perimeter and Area of Irregular Figures | Solved Example Problems
Here we will get the ideas how to solve the problems on finding the perimeter and area of irregular figures. The figure PQRSTU is a hexagon. PS is a diagonal and QY, RO, TX and UZ are the respective distances of the points Q, R, T and U from PS. If PS = 600 cm, QY = 140 cm
Mental Math on Perimeter and Area | Maths Questions Answers
In mental math on perimeter and area we will solve different type of problems on perimeter of a triangle, perimeter of a square and a rectangle, area of a rectangle, area of a square and word problems on area.
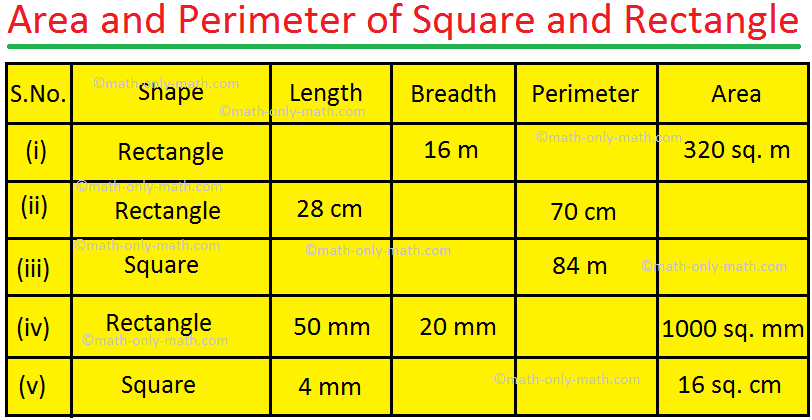
Worksheet on Area of a Square and Rectangle | Area of Squares & Rectan
We will practice the questions given in the worksheet on area of a square and rectangle. We know the amount of surface that a plane figure covers is called its area. 1. Find the area of the square length of whose sides are given below: (i) 15 m (ii) 250 m (iii) 25 cm
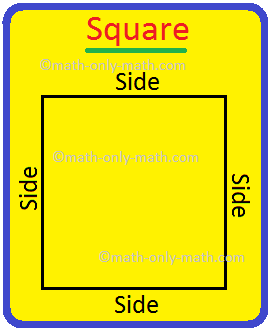
Area of a Square | Area of a Square = (Side × Side) Square Units
In area of a square we will learn how to find the area by counting squares. To find the area of a region of a closed plane figure, we draw the figure on a centimeter squared paper and then count the number of squares enclosed by the figure. We know, that square is
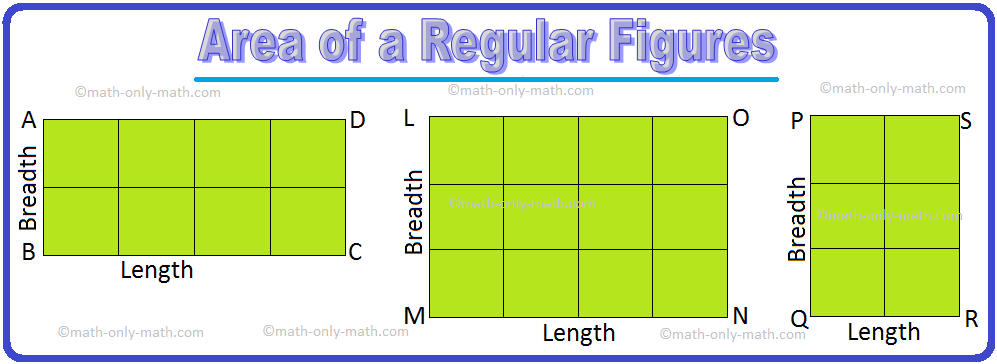
Area of a Rectangle | Area of Rectangle = Length × Breadth | Examples
Area of a rectangle is discussed here. We know, that a rectangle has length and breadth. Let us look at the rectangle given below. Each rectangle is made of squares. The side of each square is 1 cm long. The area of each square is 1 square centimeter.


● Area.
To find Area of a Rectangle when Length and Breadth are of Different Units.
To find Length or Breadth when Area of a Rectangle is given.
To find Cost of Painting or Tilling when Area and Cost per Unit is given.
To find the Number of Bricks or Tiles when Area of Path and Brick is given.
Worksheet on Area of a Square and Rectangle
5th Grade Math Problems
From Area of a Rectangle to HOME PAGE
Didn't find what you were looking for? Or want to know more information about Math Only Math. Use this Google Search to find what you need.

Recent Articles
-
Worksheet on Estimating Sums and Differences | Find the Estimated Sum
Jan 13, 25 01:34 PM
 In 4th grade worksheet on estimating sums and differences, all grade students can practice the questions on estimations.This exercise sheet on estimating sums and differences can be practiced
 -
Worksheet on Mixed Addition and Subtraction | Questions on Addition
Jan 12, 25 02:14 PM
In worksheet on mixed addition and subtraction the questions involve both addition and subtraction together; all grade students can practice the questions on addition and subtraction together. -
Estimating Sums and Differences | Estimations | Practical Calculations
Jan 12, 25 02:02 PM
 For estimating sums and differences in the number we use the rounded numbers for estimations to its nearest tens, hundred, and thousand. In many practical calculations, only an approximation is requir…
 -
Combination of Addition and Subtraction | Mixed Addition & Subtraction
Jan 12, 25 01:36 PM
 We will discuss here about the combination of addition and subtraction. The rules which can be used to solve the sums involving addition (+) and subtraction (-) together are: I: First add
 -
Checking Subtraction using Addition |Use Addition to Check Subtraction
Jan 12, 25 01:13 PM
 We can check subtraction by adding the difference to the smaller number. Since the sum of difference and smaller number is equal to the larger number, subtraction is correct.
New! Comments
Have your say about what you just read! Leave me a comment in the box below. Ask a Question or Answer a Question.